
To better understand Americans’ well-being, we asked U.S. adults how often they feel lonely or isolated from those around them and how often they feel optimistic about their lives.
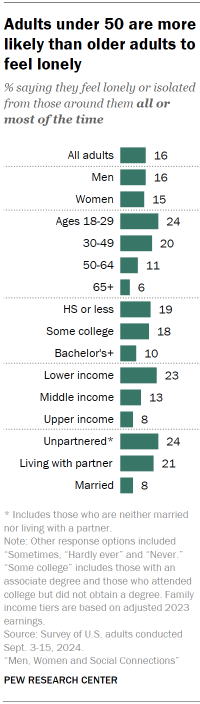
How often do Americans feel lonely?
There are differences across demographic groups in the shares saying they feel lonely or isolated all or most of the time. The following groups are among the most likely to say they often feel this way:
- Adults younger than 50
- Adults with some college or less education
- Lower-income Americans
- Adults who are unpartnered or living with a partner they’re not married to
There is no significant difference between the shares of men and women saying they often feel lonely or isolated. This remains true across all age groups.
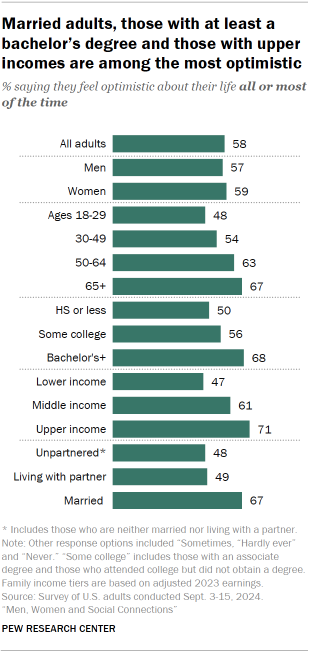
How often do Americans feel optimistic?
A majority of adults (58%) say they feel optimistic about their life all or most of the time, while 32% say they feel this way sometimes. One-in-ten say they hardly ever or never feel optimistic.
As is the case with feelings of loneliness, the shares saying they often feel optimistic vary by age, education, income and marital status. For the most part, the patterns are the opposite of what we see with loneliness.
These groups are among the most likely to say they feel optimistic all or most of the time:
- Adults ages 50 and older
- Adults with a bachelor’s degree or more education
- Upper-income adults
- Married adults


