The American Trends Panel, created by the Pew Research Center, is a nationally representative probability-based panel of randomly selected U.S. adults recruited from landline and cellphone random-digit dial (RDD) surveys. Panelists participate via monthly self-administered web surveys. Panelists who do not have internet access are provided with a tablet and wireless internet connection. The panel is managed by Abt SRBI.
Members of the ATP were recruited from two large, national landline and cellphone RDD surveys conducted in English and Spanish. At the end of each survey, respondents were invited to join the panel. The first group of panelists was recruited from a Center survey conducted Jan. 23 to March 16, 2014. Of the 10,013 adults interviewed, 9,809 were invited to take part in the panel and a total of 5,338 agreed to participate.5 The second group of panelists was recruited from a Center survey conducted August 27 to October 4, 2015. Of the 6,004 adults interviewed, all were invited to join the panel, and 2,976 agreed to participate.6
Data in this report are drawn from the panel wave conducted Feb. 28-March 12, 2017.7
A total of 3,844 panelists completed the survey. Of these, 2,066 were online and 1,778 were by phone. The margin of error for the web and telephone groups is plus or minus 3.7 and 4.0 percentage points, respectively.
Sampling errors and statistical tests of significance take into account the effect of weighting. Interviews are conducted in both English and Spanish, but the Hispanic sample in the ATP is predominantly native born and English speaking.
The following table shows the unweighted sample sizes and the error attributable to sampling that would be expected at the 95% level of confidence for different groups in the survey:
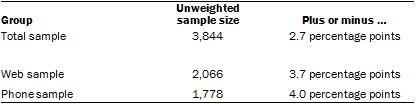
Sample sizes and sampling errors for other subgroups are available upon request.
In addition to sampling error, one should bear in mind that question wording and practical difficulties in conducting surveys can introduce error or bias into the findings of opinion polls.
The web component of the February 2017 mode effects study had a response rate of 80% (2,066 responses among 2,596 individuals sampled from the panel), while the phone component had a response rate of 69% (1,778 responses among 2,595 individuals sampled from the panel). Taking into account the combined, weighted response rate for the recruitment surveys (10.0%) and attrition from panel members who were removed at their request or for inactivity, the cumulative response rate for the wave is 2.4%.8
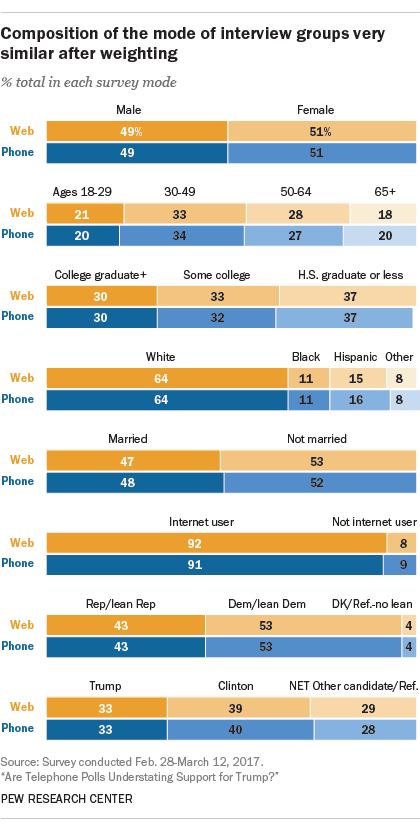
Ensuring the equivalence of web and phone groups
In order to be confident that any observed differences in responses between the web and phone groups are truly attributable to the difference in mode of administration, it was important that the groups be equivalent in their demographic and political profiles. One advantage of conducting this experiment with the ATP was the availability of numerous demographic and political variables that had been measured on the panel prior to this study. This data was leveraged in the design and analysis of the study to make sure that the two groups were as comparable as possible.
Panelists were assigned to take the survey either by telephone or online by stratifying the panel into blocks based on age, sex, education, race, language, party identification and whether they took ATP surveys by mail prior to the panel’s transition to fully online data collection. Within each block, panelists were placed in a random order and assigned to either the web or phone groups in alternating sequence. This procedure, known as a randomized block design, helped to ensure that assignment to the web and phone groups was balanced on the dimensions used in the stratification.
Even though the mode of interview was assigned in a balanced fashion, it was still possible that certain kinds of people would be more likely to respond in one mode than the other. To correct any imbalances that may have occurred due to differential response, the web and phone groups were each weighted separately according to the ATP’s standard weighting procedures. Each group was weighted in a multi-step process that begins with a base weight incorporating the respondents’ original survey selection probability and the fact that in 2014 some panelists were subsampled for invitation to the panel.
Next, an adjustment was made for the fact that the propensity to join the panel and remain an active panelist varied across different groups in the sample. The final step in the weighting used an iterative technique that aligns the sample to population benchmarks on a number of dimensions. Gender, age, education, race, Hispanic origin and region parameters came from the U.S. Census Bureau’s 2015 American Community Survey. The county-level population density parameter (deciles) came from the 2010 U.S. Decennial Census. The telephone service benchmark came from the January-June 2016 National Health Interview Survey and is projected to 2017. The volunteerism benchmark came from the 2015 Current Population Survey Volunteer Supplement. The party affiliation benchmark was the average of the results from the three most recent Pew Research Center general public telephone surveys. The Internet access benchmark came from a 2015 Center survey. Respondents who did not previously have internet access were treated as not having internet access for weighting purposes.
After the standard weights were applied to each group, there remained a slight imbalance between the web and phone groups in terms of candidate support in the 2016 presidential election. The measure was asked on the November 2016 ATP wave. To ensure that this difference did not induce spurious results, the web and phone groups were also weighted so that the shares who supported Clinton, Trump, other candidates or who did not respond to the November survey were equal across modes. The data were not weighted to match the actual election result, but rather to the distribution that was observed under the standard weighting procedure for the full sample (web and phone combined).