
A preliminary analysis of the 2018 midterm elections finds considerable continuity in the voting patterns of several key religious groups. White evangelical or born-again Christians backed Republican candidates for the U.S. House of Representatives at about the same rate they did in 2014. Meanwhile, religiously unaffiliated voters (also known as religious “nones”) and Jewish voters once again backed Democratic candidates by large margins.
Three-quarters (75%) of white voters who describe themselves as evangelical or born-again Christians (a group that includes Protestants, Catholics and members of other faiths) voted for Republican House candidates in 2018, according to National Election Pool (NEP) exit poll data reported by NBC News. That is on par with the share who did so in midterm elections in 2014 (78%) and 2010 (77%).
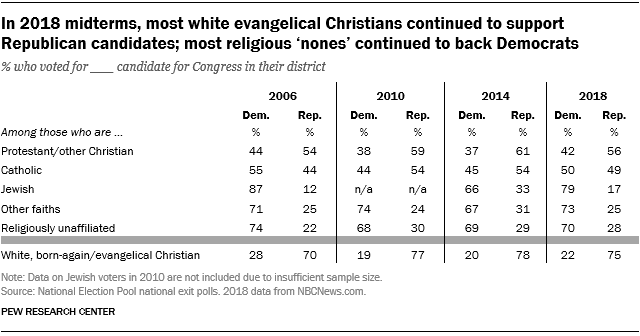
At the other end of the spectrum, seven-in-ten religious “nones” voted for the Democratic candidate in their congressional district, which is virtually identical to the share of religious “nones” who voted for Democratic candidates in 2014 and 2010. Roughly eight-in-ten Jewish voters (79%) cast their ballots for the Democrats, higher than the share who did so in 2014, but somewhat shy of 2006 levels. (Data on Jewish voters were not available in 2010.)
The 2018 exit polls show a slight shift in Catholic voting patterns compared with recent midterm elections. This year, Catholic voters were evenly split between the parties: 50% favored the Democratic candidate for Congress in their district, while 49% favored the GOP’s nominee. In the past two midterm elections (2014 and 2010), Catholics leaned in favor of Republican candidates by margins of roughly 10 percentage points.
Among Protestants, 56% voted for Republican congressional candidates and 42% backed Democrats. Among those who identify with faiths other than Christianity and Judaism (including Muslims, Buddhists, Hindus and many others), 73% voted for Democratic congressional candidates while 25% supported Republicans.
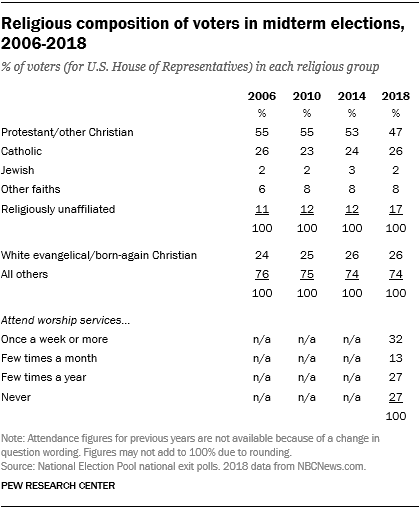
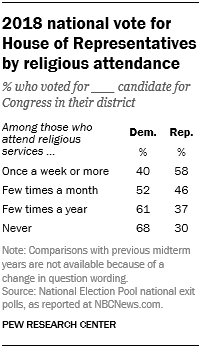
Voters who say they attend religious services at least once a week backed Republican candidates over Democrats in their congressional districts by an 18-point margin. Those who attend services less often tilted in favor of the Democratic Party, including two-thirds (68%) of those who say they never attend worship services.
Analysis of the religious composition of the 2018 midterm electorate shows that 17% of voters were religiously unaffiliated, up from 12% in 2014 and 2010. Meanwhile, 47% of voters in 2018 were Protestants, down from 53% in 2014 and 55% in 2010. There was little change in the share of voters who identify as Catholic, Jewish or with other faiths. And the 26% of 2018 voters who were white and identify as born-again or evangelical Christians is similar to other recent midterm elections.
This preliminary analysis reflects data for 2018 as published by NBC News as of 11 a.m. on Nov. 7, 2018. If data are subsequently reweighted by the National Election Pool (NEP), the consortium of news organizations that conducts the exit polls, the numbers reported here may differ slightly from figures accessible through the websites of NEP member organizations.
Related posts:
The 2018 midterm vote: Divisions by race, gender, education
Key takeaways about Latino voters in the 2018 midterm elections

