
Pew Research Center’s new political typology report is our seventh such study since 1987. Like its predecessors, this year’s typology is an effort to go beyond partisanship and categorize people based on the combination of political values they hold as a way of better understanding the complexities of the current political landscape.
The 2017 typology study is a companion to our recent study on the growing partisan divide in American politics. While the first report documents how gaps between Republicans and Democrats have grown over time, the typology provides a look at internal divisions within both the Republican and Democratic coalitions. Both reports draw on a pair of surveys conducted with a total of 5,009 adults nationwide this summer.
The typology divides the public into eight political groups – four largely Republican groups and four largely Democratic groups – along with a ninth group of less politically engaged Americans, whom we call Bystanders. See where you fit in the typology by taking our quiz.
Core Conservatives: In many ways the most traditional group of Republicans. Overwhelmingly support smaller government and lower corporate taxes, and a majority think U.S. involvement in the global economy is a good thing. Country First Conservatives: Older and less educated than other GOP-leaning typology groups. Unhappy with the nation’s course, highly critical of immigrants and wary of U.S. involvement abroad. Market Skeptic Republicans: Stand out from other Republican-oriented groups in their negative views of the economic system. Skeptical of banks and financial institutions, and support raising taxes on corporations New Era Enterprisers: Optimistic about state of the nation and its future. Younger and somewhat less overwhelmingly white than other GOP typology groups. Most say U.S. involvement in the global economy is a good thing and that immigrants strengthen the nation. Devout and Diverse: Majority nonwhite, highly financially stressed, religiously observant and older than other Democratic-leaning groups. The most politically mixed typology group, with about a quarter leaning Republican. Take somewhat more conservative views than other Democratic-leaning groups on a number of issues. Disaffected Democrats: Majority-minority group and highly financially stressed. Have positive feelings about the Democratic Party and its leaders, but are highly cynical about politics, government and how things are going in U.S. Opportunity Democrats: Less affluent, less liberal and less politically engaged than Solid Liberals, though the two groups agree on many major issues. Believe most people can get ahead if they work hard. Solid Liberals: Largest group in the Democratic coalition. Highly educated and largely white. Express liberal attitudes on virtually every issue. Say the nation should be active in world affairs. Bystanders: A relatively young, less educated group that pays little or no attention to politics.
Here are answers to some questions that are often asked about the political typology.
Do the groups in the political typology correspond to groups in the real world?
Some typology groups are more immediately recognizable as real-world groups than others. In particular, the most ideologically consistent groups, Solid Liberals and Core Conservatives, are familiar anchors of the two parties. To some degree, this is because they are the most politically engaged groups – their political “voices” are louder than those of other groups.
Mirroring some of the internal party divisions in the Republican Party playing out today, Country First Conservatives differ from Core Conservatives in key ways (though the two groups are similarly strong in their GOP partisanship). They are unhappy with the nation’s course, highly critical of immigrants and deeply wary of U.S. global involvement.
Less politically engaged groups, such as Disaffected Democrats or Devout and Diverse – both within the Democratic coalition – don’t necessarily correspond to organized groups in the political world. One reason is that politics is a peripheral concern for many people, especially for people who don’t fit comfortably within either party. The relatively low level of interest in politics, as well as a sense of futility regarding the ability to influence political decisions, reduces the incentive to organize and act, even when a relatively large number of people may have similar political views. But this can be a vicious cycle – people who feel they are “outside” of politics may feel that nobody shares their views. The typology shows that is not the case.
How do you find the groups in your data?
It would be relatively easy if we were trying to group people on the basis of only two or three issues or values. But it becomes more complex as more attitudes and values are considered. To address this, we use a statistical technique to identify groups of people who hold similar values and opinions across several questions asked in the survey, plus a measure of partisanship. This technique is called “latent class analysis” (LCA). Given the complexity of the data, it’s possible to sort respondents into many different combinations. Unlike some other statistical techniques, LCA does not produce a single “correct” result. We run the analysis numerous times – essentially, we ask it to produce various numbers of groups – and judge each result by how analytically practical and substantively meaningful it is. Many of the versions we produced had a great deal in common with the others, giving us confidence that the pattern of divisions was well-founded. Appendix 2 of the report includes more detail about our analytical approach.
Haven’t differences between the two parties become so great that all we need is the distinction between Democrats and Republicans?
The values differences between the two major U.S. political parties are, indeed, wider than at any time in recent decades. And partisan divisions extend beyond values differences: Negative views of the opposing party are much more common than in the past.
Still, political parties are a very broad way to group people and important internal partisan divides can be masked when we focus on comparing Republicans and Democrats. Parties – at least the two major political parties in the U.S. – are necessarily large agglomerations, with schisms and factions. Understanding how political values clash or cohere within each party’s coalition helps us to understand internal tensions and areas of agreement.
Does this typology differ from prior ones? Has the makeup of the U.S. public really changed that much, or are the criteria different?
There is both continuity and change in the typology when you look back over the past 30 years. We’ve nearly always found two strongly conservative groups that are divided over social issues, but this year that division seems focused more on immigration and how people define the nation. Similarly, we have often found a group of across-the-board liberals at the other end of the spectrum. Closer to the middle, a group (or two) of financially hard-pressed and sometimes politically disaffected individuals usually emerges, along with one or two younger, more upbeat groups.
Many of the questions that went into this year’s typology have been used in the past, though there have been some changes. The use of LCA as a statistical approach is also a shift from the past. Prior typologies used a closely related technique: Cluster analysis using the k-means algorithm. LCA is somewhat better suited for questions structured like those asked in the typology questionnaire, which ask respondents to choose between two statements. Based on extensive testing, k-means and other clustering algorithms would have produced largely similar groups to the LCA method.
I don’t think I fit in any of these groups. Why is that?
If your combination of values represents less than 5% of the general public, you wouldn’t have been identified by our method. In addition, it’s possible that a group could be defined by issues and values other than the ones we asked about (and this approach wouldn’t find that group).
The typology, for instance, doesn’t find a libertarian group. As was the case in 2014, the unique combination of values associated with libertarianism doesn’t coalesce in a single group. Both New Era Enterprisers and Core Conservatives express some libertarian views, but each diverges from libertarianism in important ways. For example, New Era Enterprisers are socially liberal and fiscally conservative, but they are more supportive of government regulation than are other Republican-leaning groups.
The typology is based on people’s responses to a set of political values across a variety of political domains. If there are divisions not based on core values (i.e., differences on political tactics, or about which among an agreed set of values are more important) those will not be reflected in the typology assignments.
Why are there only two options for each of the questions? Some of the questions feel like choosing between two extremes or that the right answer is somewhere in between.
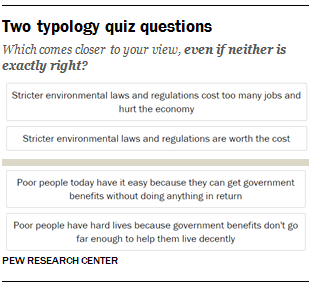
We hear this question a lot. The “forced choice” construction of these questions is part of its design. We ask respondents which of two statements on a core value people lean toward, which does not necessarily presume complete agreement with either answer. That is why the instructions ask, “Which comes closer to your view, even if neither is exactly right?”
Though most questions in the quiz present two opposing views (for example: “stricter environmental laws and regulations cost too many jobs and hurt the economy” or “stricter environmental laws and regulations are worth the cost), some present starker options.
Take the second question shown here. The two options present very different ways of thinking about poverty, and it is possible that many people have some level of agreement with both points of view.
At the same time, questions surrounding the adequacy of government benefits to the poor continue to reflect a fundamental debate in politics. And it is safe to say that most people at least lean one way or the other on this difficult trade-off. Among the public overall, 38% choose the first statement, while 53% choose the second – and their choice is strongly related to their specific policy preferences and priorities in this area.
In addition, this year’s typology builds upon the more than two decades that Pew Research Center has been asking many of these specific questions. Some of these questions use language that is different from how we might ask them if we were developing them for the first time. But there is a great deal of value in maintaining identical question wording in order to measure change over time. On the question about government benefits for the poor, for example, just after the GOP had recaptured control of Congress in 1995 on a conservative tide, the numbers on this question were roughly the reverse of what they are today. And in recent years, the share saying government benefits “don’t go far enough” has increased sharply among Democrats, while holding steady among Republicans.
