
The Latino population in the United States has reached nearly 58 million in 2016 and has been the principal driver of U.S. demographic growth, accounting for half of national population growth since 2000. The Latino population itself has evolved during this time, with changes in immigration, education and other characteristics.
This summary draws on a statistical portrait of the nation’s Hispanic population, which includes trends going back to 1980. Here are some key facts about the nation’s Latino population.
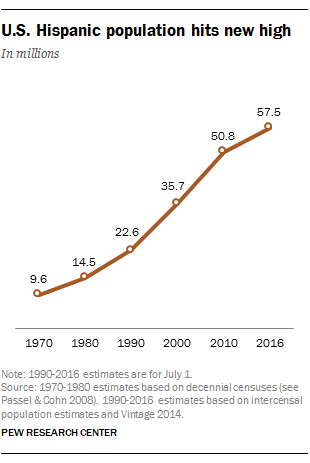
The Hispanic population has reached a new high, but growth has slowed. In 2016, Hispanics accounted for 18% of the nation’s population and were the second-largest racial or ethnic group behind whites. (All racial groups are single race non-Hispanic.)
View interactive charts and detailed tables on U.S. Hispanics.
They are also the nation’s second-fastest-growing racial or ethnic group, with a 2.0% growth rate between 2015 and 2016 compared with a 3.0% rate for Asians. The slowing of Hispanic population growth is occurring as immigration to the U.S. from Mexico levels off and the fertility rate among Hispanic women declines.
The U.S. Hispanic population is drawn from an increasingly diverse mix of countries. Hispanics of Mexican origin account for 63.3% (36 million) of the nation’s Hispanic population in 2015, by far the largest share of any origin group, but down from a recent peak of 65.7 in 2008. But this share has declined in recent years as fewer migrants from Mexico arrive in the U.S. and the number leaving the country rises. Meanwhile, the share among non-Mexican origin groups (36.7% in 2015, up from 34.3% in 2008) has grown as migration from elsewhere in Latin America has increased.
[callout align=”alignright”]
Hispanic origin profiles, 2015
Download the excel sheet with data on the 14 largest U.S. Hispanic groups by origin (based on self-described race or ethnicity).
The population of Hispanics of Puerto Rican origin, the second-largest origin group, stands at 5.4 million in 2015 in the 50 states and the District of Columbia (an additional 3.4 million people live in Puerto Rico). The migration of Puerto Ricans to the U.S. mainland over the past decade has helped drive up this number from 3.8 million in 2005. Five other Hispanic origin groups have populations of more than 1 million – Salvadorans, Cubans, Dominicans, Guatemalans and Colombians – and each has also seen its population increase over the past decade.
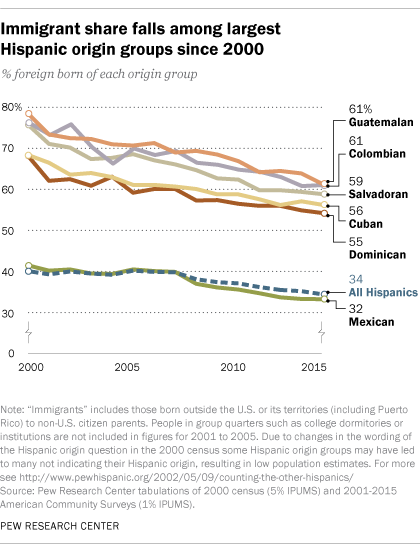
The foreign-born share has declined among U.S. Latinos. Today, 34.4% of Latinos are immigrants, down from a peak of 40.1% in 2000. And the share that is U.S. born has grown to 65.6% in 2015, up from 59.9% in 2000. This decline in the foreign-born share extends across the largest Latino origin groups. The foreign-born share among Guatemalans (61.3% in 2015) fell by 17.2 percentage points during this time, the largest percentage-point decline of the six largest Hispanic origin groups. Salvadorans’ foreign-born share (58.8% in 2015) also had a significant drop, declining 16.9 percentage points. Meanwhile, the Mexican foreign born share (32.2% in 2015), had a smaller decline – 9.3 points.
U.S. Hispanics are the youngest of the nation’s largest racial and ethnic groups. But like the rest of the country, the Hispanic population overall has grown older. Hispanics had a median age of 28 in 2015, up from 25 in 2000. Whites had the highest median age – of 43 in 2015 – followed by Asians (36) and blacks (34). Among Hispanics, those born in the U.S. and those born in another country differ widely in age. The median age of U.S.-born Hispanics was 19 in 2015, up from 18 years in 2000. Meanwhile, foreign-born Hispanics have a median age of 42 years, up from 33 in 2000.
A growing share of Hispanics have gone to college. Almost 40% of Hispanics ages 25 and older had any college experience in 2015, up from 30% in 2000. Among U.S.-born Hispanics, 52% reported they had gone to college, an increase from 41% in 2000. By comparison, 27% of foreign-born Hispanics reported some college experience, up from 22% in 2000.
The number of Hispanics who speak Spanish at home is at an all-time high, though growth is slowing. A record 37 million Hispanics ages 5 and older speak Spanish at home, up from 25 million in 2000. However, between 2010 and 2015, this number grew at an annual average of 1.8%, down from an annual average of 3.4% between 2000 and 2010.
At the same time, a record 35 million Hispanics ages 5 and older say they are English-proficient, up from 19 million in 2000. Among this group, 14 million Hispanics speak only English at home in 2015, up from 7 million in 2000.
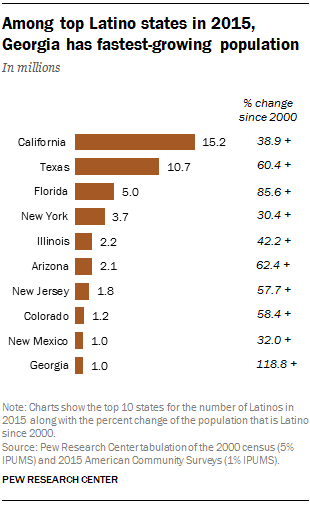
California continues to have the largest Latino population among states, but Texas is seeing a faster growth rate. In 2015, 15.2 million Hispanics lived in California, a 39% increase from 10.9 million in 2000. Yet Texas has had even faster growth, with its Hispanic population increasing 60% over the same period, from 6.7 million in 2000 to 10.7 million in 2015. Meanwhile, Georgia’s Hispanic population has more than doubled since 2000, the fastest growth among the 10 states with the largest Hispanic populations.
Related posts:
U.S. Hispanic population growth has leveled off
Hispanic dropout rate hits new low, college enrollment at new high
