The early days of a new presidential administration produce not just a blizzard of news but a blizzard of numbers. Pollsters of all stripes race to get and report Americans’ first impressions of their new president. But, frustratingly, those reports don’t always match up as precisely as the Type A among us might wish.
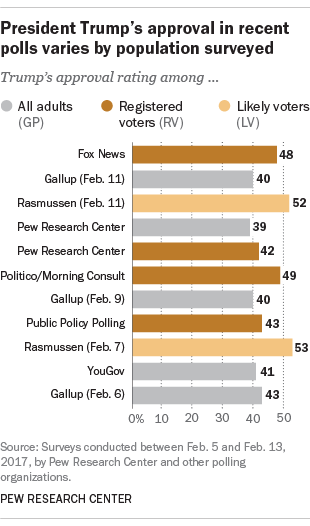
Take the past three weeks of polling on President Donald Trump. Depending on the poll, Trump’s approval rating between Feb. 5 and 13 could have been as high as 53% or as low as 39%. So which was it?
There are a number of possible reasons for polls arriving at different estimates – from the mode used to collect data to how people are selected for a survey – but here we’ll tackle one of the most basic: Did the poll include or exclude the 45% of adult Americans who didn’t cast a vote last November?

Typically, polls in the U.S. are designed to represent one of three populations. The broadest is the general population of all adults (GP). Surveys based only on adults who are registered to vote (RV) apply a narrower lens on the public. Narrower still is the filter applied with surveys that interview only registered voters who are deemed likely to vote (LV). Many pollsters might conduct surveys of all three, depending on where they find themselves in the election cycle.
In non-election years like this one, most pollsters survey all adults, but not all follow this convention. A number of pollsters continue to do surveys of registered or even likely voters. Why does this matter for Trump’s approval ratings? It’s about demographics. Voters as a group skew older and whiter than the general public. And older Americans, as well as white Americans, tilt more Republican than other groups. So, voter-only polls tend to get somewhat more favorable views of a Republican president or candidate and less favorable views of Democrats. This pattern was evident during Barack Obama’s presidency, with his overall ratings tending to be somewhat higher among the general public than among registered or likely voters.
A look at some of the presidential approval numbers released this month shows a pattern consistent with these demographic differences. LV polls – those surveys based only on the views of “likely voters” – are generally reporting higher levels of support for Trump than general population polls. There is a more muted but still significant difference in an RV-GP comparison: Pew Research Center’s general population poll conducted Feb. 7-12 recorded Trump’s presidential approval rating at 39%. Among registered voters in that survey, his rating was 42%.
Registered voter polls exclude nearly 40% of the population
So how many people are we including, or excluding, when we decide to look at the views of only registered or likely voters? In the U.S., roughly six-in-ten adults are registered to vote. The registration rate tends to tick up a few points in presidential election years (to about 65%) and back down a few points in non-election years. This means that RV polls, by design, exclude nearly 40% of adults living in the U.S.
LV polls, of course, exclude even more, as they aim to include only those registered voters who actually cast, or will cast, a ballot. The voting rate among adults ages 18 and older was 55% in the 2016 presidential election and 33% in the most recent midterm election. If a pollster is currently conducting an LV poll with 2018 (a midterm election year) in mind, then recent midterm voting behavior suggests that their results might be excluding the views of a majority of adults in the U.S.
So what is the appropriate population to represent?
Which population is appropriate – all adults, registered voters or likely voters – depends on what information the poll is intended to gather. For political operatives whose jobs (winning elections) require them to be in perpetual campaign mode, polls of registered or likely voters arguably provide the most accurate information about the mood and opinions of that subset of Americans who will actually cast a ballot in the next election. The fact that the poll excludes a large share of the population is a desired feature, not a bug.
For those interested in the opinions and experiences of the entire country, as is the case here at the Center, general population polls are a more informative and useful tool. Nonvoters, like any other group of Americans, include people who pay taxes, want health insurance, run small businesses, use the public education or court systems and have a stake in the nation’s security – even though they do not play a role in selecting the officials who craft the public policies that affect them.
A last thought on nonvoters
While nonvoters do lean more Democratic than Republican, it would be a mistake to cast them as a partisan lot. Overall, they are much less likely than registered adults to identify with either major party (24% don’t lean toward either party, compared with 6% among voters). So polls that exclude nonvoters don’t just change the shade of the country’s partisan balance, they paint a portrait of a public that is distinctly more politically engaged and ideological than those that survey all adults.
Correction: A previous version of this post and accompanying chart gave an incorrect figure for the Feb. 7 Rasmussen poll.

