
Among the most striking trends in the field of survey research in the past two decades is the shift from interviewer-administered to self-administered surveys. Fueled by the growth of the internet, self-administration as a survey mode presents a mixture of opportunities and challenges to the field. Self-administered surveys tend to be less expensive and to provide ways of asking questions that are difficult or impossible to ask in an interviewer-administered survey.
But the results from self-administered and interviewer-administered surveys are sometimes different. This difference is called a mode effect, a difference in responses to a survey question attributable to the mode in which the question is administered. Among the issues this raises are how to track trends in responses over time when the mode of interview has changed and how to handle the inconsistencies when combining data gathered using different modes.
Using its nationally representative American Trends Panel, Pew Research Center conducted a large-scale experiment that tested the effects of the mode of survey interview – in this case, a telephone survey with an interviewer vs. a self-administered survey on the Web – on results from a set of 60 questions like those commonly asked by the center’s research programs. This report describes the effort to catalog and evaluate mode effects in public opinion surveys.
The study finds that differences in responses by survey mode are fairly common, but typically not large, with a mean difference of 5.5 percentage points and a median difference of five points across the 60 questions. The differences range in size from 0 to 18 percentage points. The results are based on 3,003 respondents who were randomly assigned to either the phone or Web mode and interviewed July 7-Aug. 4, 2014 for this study.
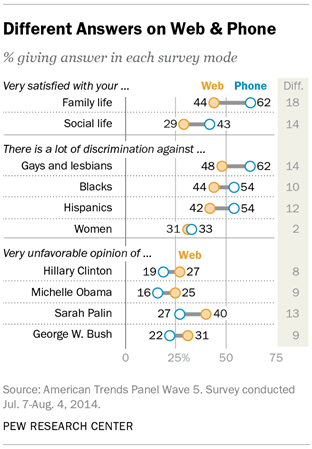
Where differences occurred, they were especially large on three broad types of questions: Items that asked the respondent to assess the quality of their family and social life produced differences of 18 and 14 percentage points, respectively, with those interviewed on the phone reporting higher levels of satisfaction than those who completed the survey on the Web.
Questions about societal discrimination against several different groups also produced large differences, with telephone respondents more apt than Web respondents to say that gays and lesbians, Hispanics and blacks face a lot of discrimination. However, there was no significant mode difference in responses to the question of whether women face a lot of discrimination.
Web respondents were far more likely than those interviewed on the phone to give various political figures a “very unfavorable” rating, a tendency that was concentrated among members of the opposite party of each figure rated.
Statistically significant mode effects also were observed on several other questions. Telephone respondents were more likely than those interviewed on the Web to say they often talked with their neighbors, to rate their communities as an “excellent” place to live and to rate their own health as “excellent.” Web respondents were more likely than phone respondents to report being unable to afford food or needed medical care at some point in the past twelve months.
One important concern about mode effects is that they do not always affect all respondents in the same way. Certain kinds of respondents may be more vulnerable than others to the effect of the mode of interview. In some instances, this may be a consequence of cognitive factors; for example, well-educated respondents may be better able than those with less education to comprehend written questions. In other instances, the sensitivity of a question may be greater for certain respondents than for others; for example, mode effects on questions about financial difficulties may be much larger among low income individuals — the people most likely to experience such troubles.1
Despite these sometimes substantial differences, the study found that many commonly used survey questions evidence no mode effect. Reports about various personal activities performed “yesterday” – such as getting news from a newspaper, on television or on the radio; calling a friend or relative; writing or receiving a letter; or getting some type of exercise – showed no significant differences by mode of interview. And most questions about religious affiliation, belief and practice yielded similar results on the Web and on the phone, though Web respondents were somewhat more likely than those interviewed on the telephone to say that they “seldom” or “never” attended religious services.
About the Study
This study was conducted using Pew Research Center’s nationally representative American Trends Panel (ATP). Panelists who normally take their surveys on the Web were randomly assigned to either the phone mode (N=1,494 completed by phone) or the Web mode (N=1,509 completed on the Web). Each set of respondents was independently weighted to be representative of the U.S. public in an effort to ensure that any differences observed between the groups were a result only of mode of interview effects. Mode differences for each question in the study were measured by comparing answers given by the Web and phone groups using a commonly reported category of each question in the study or the category that shows the largest mode difference — whichever is larger.
Why Mode of Interview Effects Occur
The experience of being interviewed by another person differs from completing a survey online or on paper. For example, an interviewer can help respondents stay focused and may be able to provide clarification or encouragement at difficult junctures during the interview.
But the social interaction inherent in a telephone or in-person interview may also exert subtle pressures on respondents that affect how they answer questions. Respondents may feel a need to present themselves in a more positive light to an interviewer, leading to an overstatement of socially desirable behaviors and attitudes and an understatement of opinions and behaviors they fear would elicit disapproval from another person. Previous research has shown that respondents understate such activities as drug and alcohol use and overstate activities like donating to charity or helping other people. This phenomenon is often referred to as “social desirability bias.” These effects may be stronger among certain types of people than others, introducing additional bias into the results.2
Most of the largest mode differences observed in this study are observed on questions where social desirability bias could play a role in the responses. Of the 21 items showing a difference by mode of at least seven percentage points, seven involve ratings of political figures (and very negative ratings are less prevalent for all seven items on the phone than on the Web), four involve questions about intimate personal issues including life satisfaction, health status and financial troubles (with positive responses more common on the phone across all of them) and three relate to perceptions of discrimination against minority groups (with phone respondents more likely to say there is discrimination against each group). Two other questions that fit within this framework are talking with neighbors and attending religious services. Phone respondents were 11 points more likely than Web respondents to say they talked with neighbors at least a few times a week. Web respondents were seven points more likely than phone respondents to say that they seldom or never attend religious services.
But not all questions that touch on potentially sensitive topics or involve behaviors that are socially desirable or undesirable exhibited mode effects. For example, there was no significant mode difference in how people rated their own personal happiness; or in the percentages of people who said they had done volunteer work in the past year, called a friend or relative yesterday just to talk, or visited with family or friends yesterday. There also were no differences by mode in the shares of people who are religiously unaffiliated, think that a person must believe in God in order to be moral or say that religion is very important in their life.
In addition, there are other sources of mode difference apart from social desirability. Because surveys require cognitive processing of words and phrases to understand a question and choose an appropriate response option, the channel in which the question and options are communicated can also affect responses. A complicated question with many different response options may be very difficult to comprehend when someone hears it on the phone, but easier to process when read online or on paper. Because they are easier to remember, the last response option read by an interviewer may be favored by respondents — a phenomenon called the “recency effect.” This effect is less prevalent in a self-administered survey, where respondents can see all of the response options in a glance or can go back and re-read a question on their own.3
One question in the survey was lengthy and somewhat complicated and could have posed a greater challenge to phone than Web respondents: an item that asked respondents to place themselves in one or more of a set of racial or ethnic categories. This item was modeled on a new question under review by the U.S. Census that, for the first time, includes Hispanic origin as an option along with the more traditional race categories such as white, black or African American, Asian or Asian American. Yet respondents on the phone and the Web gave nearly identical answers.
The implicit time pressure in an interviewer-administered survey can affect a respondent’s willingness to engage in the amount of thought necessary to recall facts or past events, leading to different answers than would be obtained if no interviewer were involved. And, of course, the absence of an interviewer might make it more likely that some respondents on the Web or on paper decide to speed through a questionnaire in order to finish more quickly, thus providing lower-quality data.
In general, we found little evidence that cognitive processes of these sorts created mode differences in responses. That may reflect the fact that the questions chosen for this study are drawn from well-tested items designed for telephone surveys, and thus do not reflect the kinds of burdensome items that have previously been shown to create mode effects. It’s also possible that the panelists, having participated in one large telephone survey with Pew Research Center (the polarization study that was used to recruit the American Trends Panel) and – for the vast majority – at least one previous panel wave, are savvier survey participants than others and thus are less vulnerable to mode effects than a fresh cross-sectional sample would be.
This report presents the study’s findings in a series of sections organized by the topic of the survey questions used. Following a discussion of the study’s conclusions, there is a detailed methodological description of the study. A table presenting all of the items sorted by the size of the mode differences follows. At the end is a complete topline showing all questions and response categories.
Scope of the Mode Differences
This study is composed of mode of interview comparisons across 60 different questions covering a range of subjects and question formats. Topics include politics, religion, social relationships, daily activities, personal health, interpersonal trust and others. Question formats ranged from simple categorical items (rating one’s community as excellent, good, only fair, poor), to yes/no items (read a newspaper yesterday), to completely open-ended items (how many doctor visits in the past 12 months), to 0-100 rating scales (rate the Democratic and Republican leaders in Congress).
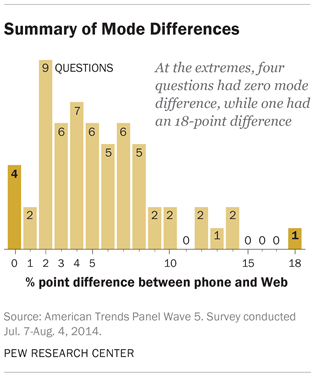
Responses to all but four of the 60 items showed at least some numerical difference by mode, and the median difference across all items was 5 percentage points. The largest difference was 18 points, and there were eight items with differences of at least 10 points. But most of the 24 non-zero differences smaller than 5 percentage points are not statistically significant, and thus could have occurred by chance as a result of sampling error.
The following sections of the report provide details about the presence or absence of mode differences across all of the measures included in the study. Each section includes an analysis of the overall results and an examination of the kinds of people most likely to be affected by the mode of interview. In general, only those differences that are statistically significant are highlighted, except in a few instances where there was a strong expectation of a mode effect and none was found.
Sizeable Mode Effects in Political Measures
Some of the largest mode differences in the study are seen in the ratings of political figures. Public views —on both sides of the aisle— are considerably more negative when expressed via the Web than over the phone. The mode differences are even larger when looking at the ratings of political figures by respondents of the opposite political party.
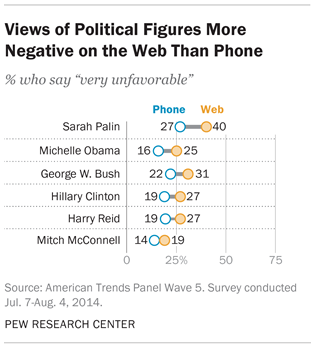
Hillary Clinton’s ratings are a good example of this pattern. When asked on the phone, 19% of respondents told interviewers they have a “very unfavorable” opinion of Clinton; that number jumps to 27% on the Web. However, like most of the political figures asked about, Clinton’s positive ratings vary only modestly by mode — 53% rate her positively on the Web, compared with 57% on the phone.
The mode effect on very unfavorable ratings is quite large among Republicans and those who lean Republican. Fully 53% of Republicans or Republican leaners hold a “very unfavorable” view of Hillary Clinton on the Web, compared with only 36% on the phone. There is no difference in Democrats’ unfavorable ratings of Clinton by mode.
A similar mode difference is also evident with ratings of Michelle Obama. While just 16% of phone respondents have a very unfavorable opinion of the First Lady, one quarter (25%) of those on the Web do so. As with Hillary Clinton, mode differences in views about Michelle Obama are largely driven by Republicans and Republican leaners. While nearly half (46%) of Republicans on the Web had a very unfavorable opinion of the First Lady, less than one-third (31%) gave the same response on the phone — a 15-point difference.
The same patterns seen with Hillary Clinton and Michelle Obama are evident for Republican political figures. Web respondents are 13 points more likely than phone respondents to view Sarah Palin as “very unfavorable.” Among Democrats and Democratic leaners, 63% express a very unfavorable view of Sarah Palin on the Web, compared with only 44% on the phone.
There is a 9-percentage point mode difference in “very unfavorable” ratings of George W. Bush (22% on the phone, 31% on the Web). Among Democrats, 49% on the Web rate the former president very unfavorably, compared with 36% on the phone.
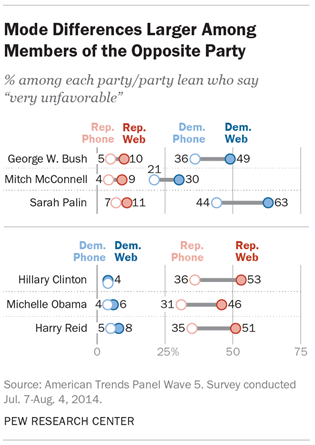
Half (51%) of Republicans on the Web report “very unfavorable” feelings towards Senate Minority Leader Harry Reid, a result 16 percentage points higher than on the phone (35%). Senate Majority Leader Mitch McConnell sees only a modest difference between negativity by mode; 14% of phone respondents are “very unfavorable” in their rating. That number climbs slightly to 19% among Web respondents.
We also observed a tendency for telephone respondents to give a higher net favorability rating on the phone for Michelle Obama (68% to 59%), George W. Bush (50% to 43%), Mitch McConnell (25% to 17%) and Harry Reid (29% to 18%). Unlike the pattern with “very unfavorable” responses, these more positive ratings occur across party lines, with both Democrats and Republicans rating leaders from both parties more favorably on the phone than on the Web.
A larger share of Web respondents indicated that they had never heard of or could not rate Harry Reid and Mitch McConnell than on the phone. On the Web, 44% would not provide a rating of McConnell, compared with 38% on the phone; 40% of Web respondents had no rating for Reid, compared with 31% of phone respondents. This is likely due to the fact that Web respondents were offered an option labeled “Never heard of/Not sure.” No explicit option was offered to respondents on the telephone, though interviewers were instructed to accept no opinion responses and not push for a rating. The presence or absence of an explicit no opinion option does not matter for the well-known figures like Hillary Clinton or George W. Bush, but makes a significant difference for the lesser-known Reid and McConnell.
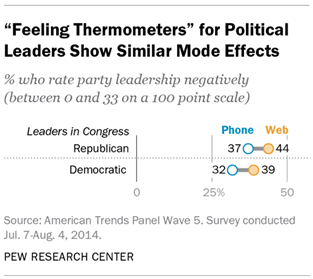
The effects of the interview mode on ratings of political figures also appear in a different question format — the “feeling thermometer” scale that varies from 0 to 100. As with the verbal scales, more people express highly negative views on the Web than on the phone. Asked to rate party leaders in Congress on a 0 to 100 scale, 44% of Web respondents give Republican leaders in Congress between 0 and 33, the “cold” or negative end of the scale. When asked on the phone, 37% gave responses in this range. That 7-percentage point difference is the same as with Democratic leaders in Congress (32% on the phone, 39% on the Web). As with ratings of specific political figures, mode differences on these scales are much larger among members of the opposite party of the group being rated.
The use of a numerical scale highlights another difference between Web and phone. Phone respondents are more likely than Web respondents to select an answer closer to the midpoint of the scale (between 34 and 66). When rating Democratic leaders in Congress, 36% of Web respondents selected a number in the middle range, compared with 45% of phone respondents.
Mode effects also appear on opinion questions about political issues. A higher percentage of respondents on the Web than on the phone say the United States should be less involved in resolving the dispute between Israel and the Palestinians (45% say this on the Web, 37% on the phone). The mode difference is even larger among Republicans (14 percentage points more likely to say on the Web than on the phone that the U.S. should be less involved in the conflict) and among white evangelical Protestants (13 percentage points more likely to say “less involved” on the Web). In fact, “less involved” is the most common response for Republicans on the Web (44%), while “more involved” is the modal response for those interviewed by phone (42%).
In thinking about the United States’ global profile more broadly, Web respondents express slightly more reluctance about U.S. involvement in the global economy than do phone respondents. On the phone, 34% of respondents say greater U.S. involvement in the global economy is a bad thing, compared with 39% on the Web.
There is little apparent difference by mode in opinions about the government’s anti-terrorism policies. About equal numbers on the phone (50%) and on the Web (51%) say that the policies have gone too far in restricting civil liberties.
Measures of Discrimination Significantly Affected by Mode
Considerable mode differences were observed on questions about societal discrimination against several groups including gays and lesbians, Hispanics and blacks, with phone respondents more likely than Web respondents to say these groups faced “a lot” of discrimination. But the impact of the mode of interview varied by the race and ethnicity of the respondents.
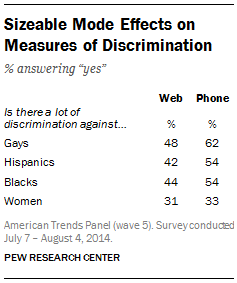
When asked about discrimination against gays and lesbians, 62% of respondents on the phone say they face “a lot” of discrimination; on the Web, only 48% give the same answer. This mode effect appears among both Democrats and Republicans. Among Democrats, 77% on the phone say the LGBT community faces “a lot” of discrimination, compared with only 62% on the Web — a 15 point difference. Among Republicans, the difference is 10 points (43% on the phone, 33% on the Web). The mode effect appears among all religious groups in the sample other than white evangelicals, where the 7-point gap between the phone and Web is not statistically significant. Underlying attitudes about gays and lesbians do not appear to affect the likelihood that people will answer differently on the phone than on the Web; the mode effect is significant and similar in size for those who think homosexuality should be discouraged by society and those who think it should be accepted.
Telephone survey respondents were also more likely than Web respondents to say Hispanics face “a lot” of discrimination (54% in the phone survey, 42% in the Web survey). Among Hispanics questioned for this study there is also a difference in response by mode: 41% on the Web say they face discrimination, while 61% on the phone say this. And there is a 14-point mode difference among white respondents. But among black respondents, there was no significant effect: 66% of blacks interviewed by phone said Hispanics face a lot of discrimination, while 61% of those interviewed on the Web said the same.
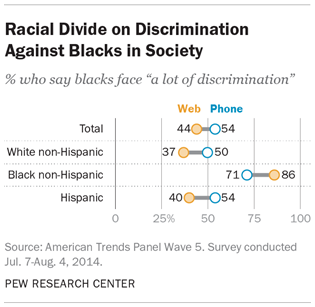
When asked about discrimination against blacks, more phone respondents (54%) than Web respondents (44%) said this group faced a lot of discrimination. This pattern was clear among whites, where 50% on the phone and just 37% on the Web said blacks face a lot of discrimination. But among blacks, the pattern is reversed: 71% of black respondents interviewed by phone say they face “a lot” of discrimination, while on the Web 86% do so.
Unlike the items about other minority groups, there is no significant mode difference in responses to the question about women. Exploration of key demographic subgroups showed similar answers on the Web and on the phone, suggesting that social desirability may not influence responses to this question.
Happiness and Life Satisfaction Higher Among Phone Respondents
Sizeable mode differences were observed on questions measuring satisfaction with family and social life. Among phone survey respondents, 62% said they were “very satisfied” with their family life; among Web respondents, just 44% said this. Asked about their social life, 43% of phone respondents said they were very satisfied, while just 29% of Web respondents said this. These sizeable differences are evident among most social and demographic groups in the survey.
The mode differences on satisfaction with social life are smallest among people who, in a different question, say they are “very happy” with their life and larger among those who say they are “pretty happy” or “not too happy.” However, answers to the happiness question itself do not vary by survey mode.
Another question in the series asked about satisfaction with traffic conditions in the respondent’s area. This item had a 6-point mode difference, with slightly more phone respondents (28%) than Web respondents (22%) saying they were very satisfied.
Respondents were also asked about satisfaction with their local community as a place to live. Phone respondents were again more positive, with 37% rating their community as an excellent place to live, compared with 30% of Web respondents. But there was no significant difference by mode in the percentage who gave a negative rating to their community (“only fair” or “poor”).
In a related item, telephone survey respondents were more likely than Web respondents to describe their neighborhood as a “very safe” place to walk after dark (55% in the phone survey, 43% in the Web survey). But few in either mode characterized their neighborhood as “not too safe” or “not at all safe.”
Volunteering, Community Involvement and Social Trust
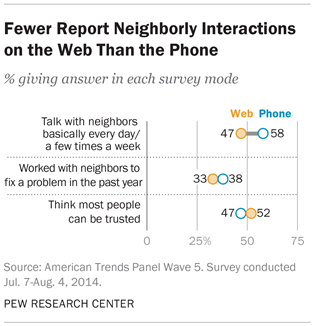
Because neighborliness and civic engagement are considered virtuous behaviors by many people, it would not be surprising to see more reports of these activities in a phone interview than on the Web. Mode differences were observed on some but not all such measures. Respondents on the phone reported more interaction with neighbors than they did on the Web. Similarly, phone respondents were more likely to say they worked in the community to fix a problem or improve a condition, but were not more likely to report engaging in volunteering through an organization. Where mode differences appear, they tend to be larger among higher income individuals.
Asked how frequently they talk to their neighbors in a typical month, 58% of phone respondents report talking to their neighbors “every day” or “a few times a week”; on the Web, 47% report doing so. The mode difference among higher income respondents (those making more than $75,000 a year) is 15 percentage points.
When asked about volunteering either in general or for youth organizations, the percentage of respondents who say they have volunteered in the past year is not significantly different in the Web and phone groups (58% vs. 61% respectively). However, among white evangelical Protestants, a sizable mode effect is observed. Seven-in-ten evangelicals on the phone (71%) report volunteering in the past year, compared with 57% on the Web — a 14-percentage point difference. By comparison, there is no significant mode effect among white mainline Protestants, Catholics or the unaffiliated.
A modest mode effect is observed on a question asking about working with other people in the neighborhood to fix a problem or improve a condition: 38% on the phone report doing so, compared with 33% on the Web. The mode difference was 10 points among higher income respondents.
One other aspect of social capital is social trust, but the study finds no significant mode difference in responses to a standard question about trusting other people.
The Impact of Mode on Reports of Financial Circumstances
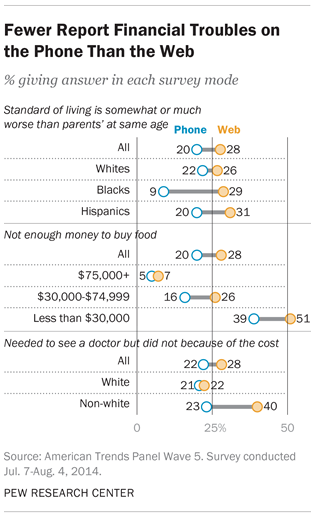
A series of questions on personal financial conditions uncover further differences in response by mode. Web respondents are more likely than those on the phone to say that in the past year they have had trouble paying for food for their family and that they were not able to see a doctor when they needed to because of cost. The effect is strongest among those with lower incomes.
Similarly, Web respondents also are more likely than phone respondents to say their standard of living is “somewhat” or “much worse” than their parents’ at a similar age (28% on the Web, 20% on the phone). This mode effect is notable among blacks, with 29% of Web respondents saying they are worse off than their parents, compared with only 9% on phone — a 20-point difference.
More Web respondents (28%) than phone respondents (20%) said they did not have enough money to buy the food their family needed in the past year. Lower income respondents (those making less than $30,000 a year) on the Web are 12 percentage points more likely than those on the phone to say that finding the money for food was an issue (51% on the Web, 39% on the phone).
In a related item, Web survey respondents are somewhat more likely than telephone survey respondents to say that in the past year they needed to see a doctor but were not able to because of cost (22% in the phone survey, 28% on the Web survey). Among non-whites, the mode gap is 17 percentage points (40% on the Web, 23% on the phone). Among whites, there is no difference (22% on the web, 21% on the phone). This question illustrates how a mode effect could lead to an incorrect conclusion: A phone interview would suggest that whites and non-whites have similar access to a doctor, while the web interview shows a sizeable difference in access.
The mode effect is particularly evident among those who say (in a separate question) that they have not seen a doctor at all in the past year. Among phone respondents who report that they have not visited a doctor in the past year, 23% say they have not seen a doctor because of cost; among Web respondents, 46% say this. By contrast, no mode effect is apparent among people who said they have been to the doctor at least once in the past year.
Modest Mode Effects on Measures of Religious Affiliation and Importance
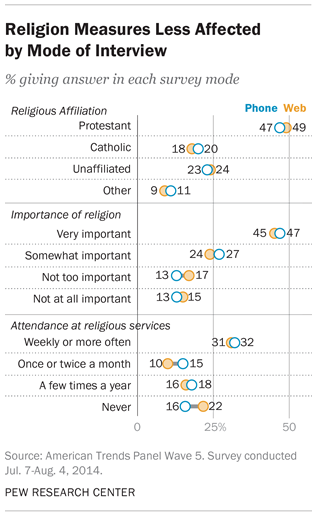
The U.S. is among the most religious of all the advanced industrial nations. Accordingly, it is possible that social pressure exists for people to report being personally religious. And yet, the study finds that for most questions about religious affiliation, belief and practice, results were similar on the Web and on the phone.
Respondents are equally likely to identify with a major religious tradition on both the Web and the phone; conversely, respondents are equally likely to identify as unaffiliated with any religion on the Web and on the phone.
Another question in the series asked about the importance of religion in one’s life. No significant mode effect is present on this item. Similarly, no mode difference is seen on a question asking if it is necessary to believe in God to be moral and have good values.
The one exception is that Web respondents were somewhat more likely than those interviewed on the telephone to say that they “seldom” or “never” attended religious services (43% on the Web, 36% on the phone). There is no mode difference in the percent reporting that they attend services at least once a week (31% on the Web, 32% on the phone).
Most of the mode effect is concentrated among people who do not affiliate with a religious tradition. Among the unaffiliated, 60% on the Web say they never attend, compared with 49% on the phone. Among people with a religious affiliation, the differences in reported attendance by mode are comparatively small.
The mode difference in reporting low levels of religious attendance is observed among men but not among women. Half of men on the Web (50%) say they seldom or never attend religious services, compared with one-third (36%) on the phone. Among women, similar numbers on the Web (37%) and phone (36%) report attending seldom or never.
Use of Internet and Technology
Questions about internet usage and technology may be particularly sensitive to survey mode if one of the modes is the internet itself. Using the internet to take a survey may bring to mind thoughts and ideas about technology use that might not arise when taking a survey by phone, simply because the context is directly related to the subject matter. It is also possible that people who are more likely to respond to a survey request when it comes via Web than via phone are different with respect to their technology use, and these differences may not be corrected by weighting.
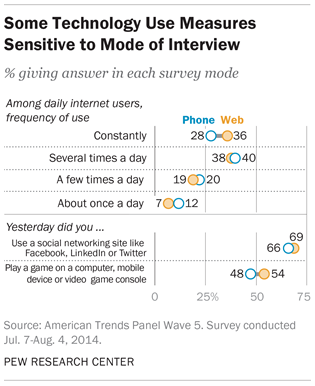
The share of respondents who reported using the internet every day was not significantly different in the Web and phone groups (84% vs. 82% respectively). But among daily internet users, the difference in regularity of use was significant, with 36% of the Web group indicating that they use the internet constantly, compared with 28% of the phone group. An examination of our panelists’ responses to questions about technology use in previous waves suggests that part of this 8-percentage point difference is attributable to differences in the type of people who were more likely to respond to the Web survey, while part is due to the mode of the interview itself.
We compared the results among respondents who indicated in Wave 1 of the panel (March-April 2014) that they use one of several social networks several times a day.4 Across both frequent and less frequent social media users, the percentage of Web respondents reporting constant internet use is 5 percentage points higher than for phone respondents. Although frequency of social media use is not a perfect proxy for constant internet use, the fact that the mode difference is identical for frequent and less frequent social media users suggests that people with similar internet usage habits answer the question in different ways depending on the mode in which it is asked.
On the other hand, exploring this previously collected data also reveals that 40% of the Web-mode respondents are frequent social media users, compared with only 30% of phone respondents. This means that the overall mode difference in the percentage reporting constant internet usage is likely a function of both the way respondents answer the question and true differences in internet usage between the two groups.
All of the participants in this experiment were enrolled in the panel for several months prior to the mode study, but they varied considerably in how many previous waves they had responded to. Those who had been regular participants were more apt to respond to this study’s invitation if they were assigned to the Web group than if they were assigned to the phone group (perhaps because that was more familiar to them). Less regular participants were the opposite: They were more likely to respond if assigned to the phone group (perhaps because they are less comfortable on the Web). In short, those who responded on the Web may be more Web savvy than their counterparts in the phone group.5 Altogether, this serves to demonstrate the difficulties inherent in conducting survey research on topics where the mode of data collection may be related to both survey participation and measurement.
For other technology related items, the effects are smaller. About half (54%) of Web respondents reported playing a game on a computer, mobile device or video game console the previous day, compared with 48% of phone respondents. Web and phone respondents were statistically equivalent in their reporting of worries about computers and technology being used to invade privacy (26% of Web respondents say they worry “a lot” vs. 22% on the phone), sending an email or a text to a friend or relative the previous day (79% for both) and use of a social networking site the previous day (69% on Web vs. to 66% on phone).
Mode Effects for Autobiographical and Factual Knowledge
Answering a survey question requires respondents to recall certain kinds of relevant information and to use this information to help formulate an answer. The mode of the interview can affect this process of recall in different ways, making it easier or more difficult for respondents to perform the necessary search of memory or by providing the motivation to conduct a thorough search. For example, an interviewer may be able to encourage respondents to make the effort to recall if they read a newspaper the previous day. At the same time, the respondents on the telephone may feel some pressure to answer quickly, so as not to keep the interviewer waiting. On the Web, respondents are free to take longer to think about the answer to a question. Time to think can be particularly important for questions that may require respondents to recall autobiographical or factual information from memory.6
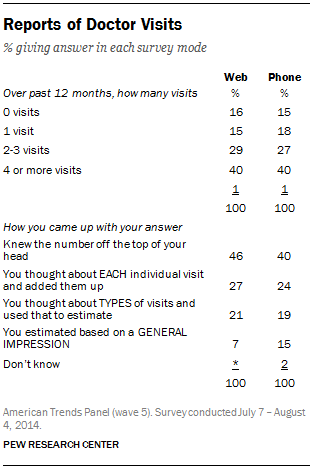
One question that might have been vulnerable to the interviewer’s presence asked for an estimate of the number of times in the past 12 months that the respondent had seen a doctor or other health care professional. Although the distribution of the answers was nearly identical on the Web and the phone, a follow-up question found interesting differences in how respondents arrived at their answers. Offered four options for how they came up with their answer, by a margin of 15% to 7%, more phone than Web respondents said that they estimated the number “based on a general impression.” This difference, though modest in size, could indicate that some phone respondents are more likely to take the easiest possible route to an answer in order to save time. Alternatively, it could reflect a recency effect in that this option was the last of the four to be read to respondents.
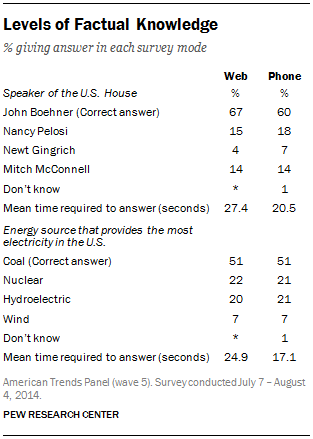
Questions of factual knowledge also require respondents to comb their memory for answers. The time afforded for cognitive processing on the Web may improve performance on these kinds of questions. On the other hand, the presence of an interviewer can provide additional motivation to respondents to think carefully about the questions.
Some researchers have expressed concern that Web respondents can cheat on knowledge quizzes by looking up the answers.7 The amount of time that respondents took to answer the questions on both the Web and the phone was recorded. For the two questions about factual knowledge, Web respondents took 7-8 seconds longer than phone respondents to answer. In comparison, there was no mode difference in the elapsed time for the attitudinal questions that preceded and followed the knowledge questions. Yet if cheating is occurring, one would expect Web respondents to do better on both questions, and they did not.
Conclusion
This study has examined the impact of survey mode on a wide range of public opinion questions drawn from those commonly asked by Pew Research Center and related organizations. While many of the differences discovered between modes are modest, some are sizeable. And many of the differences are consistent with the theory that respondents are more likely to give answers that paint themselves or their communities in a positive light, or less likely to portray themselves negatively, when they are interacting with an interviewer. This appears to be the case with the questions presenting the largest differences in the study — satisfaction with family and social life, as well as questions about the ability to pay for food and medical care. The fact that telephone respondents consistently exhibit more socially desirable reporting is consistent with a large body of preexisting literature on the topic. For most of these and other differences described here, there is no way to determine whether the telephone or the Web responses are more accurate, though previous research examining questions for which the true value is known have found that self-administered surveys generally elicit more accurate information than interviewer-administered surveys.8
Another set of questions that exhibited large differences pertained to attitudes toward political figures. For four of the six figures we asked panelists to rate, the net favorable rating was significantly higher in the phone group than in the Web group. At the same time, panelists in the Web group were significantly more likely to choose “very unfavorable” for all six of the individuals asked about. While attitudes about political figures may not be sensitive in the way that reports about family life or financial trouble are sensitive, some recent research has suggested that when interviewers are present, respondents may choose answers that are less likely to produce an uncomfortable interaction with the interviewer.9 This dynamic may also be in effect among black respondents on the phone who – compared with those surveyed on the Web – are less likely to tell an interviewer that blacks face a lot of discrimination. In the interest of maintaining rapport with an interviewer, respondents may self-censor or moderate their views in ways that they would not online.
Also notable is the fact that these effects of survey mode are distributed unevenly throughout the population. For example, Web respondents were much more likely to rate political figures highly unfavorably when the subject is a member of the opposing party. While blacks interviewed on the phone were less likely to acknowledge discrimination against blacks than were those interviewed on the Web, non-blacks were significantly more likely to do so.
We did see evidence that reports of frequent internet use may be inflated in Web surveys relative to phone surveys, as well as indications that heavy internet users are more prevalent in the Web sample. Although responses to other questions about technology use were largely consistent across modes, researchers should be aware of the potential for differences due to both nonresponse and measurement error when studying these kinds of items.
Yet while significant mode effects are seen on a variety of measures, an equal number displayed only small or non-existent mode differences. Many of the items asking about concrete events, characteristics or attributes did not appear affected by the mode of interview. These included questions about passport and driver’s license ownership, race and religious affiliation, as well as most questions about specific activities engaged in “yesterday.”
What then should survey designers do when deciding among modes of data collection? This study suggests that there may be advantages to self-administered data collection via the Web, particularly if the survey seeks to measure socially desirable or sensitive topics. The willingness of respondents to express more negative attitudes about their personal lives or toward political figures could reflect a greater level of candidness, although we have no way of knowing which set of answers is more consistent with actual behavior outside of the survey context.
That being said, this study can only speak to the possible effects of mode choice on measurement error, which is only one of many possible sources of error that can affect survey quality. Great pains were taken to ensure that the experimental groups were equivalent, and the sample comes from a pre-recruited, probability-based Web panel. Even in this carefully controlled scenario, we found that respondents who had ignored all previous survey requests were more likely to respond when they were contacted over the phone.
Even with declining response rates, telephone surveys continue to provide access to survey samples that are broadly representative of the general public. Many members of the general public still lack reliable access to the internet, making coverage a concern in practice. Random Digit Dial (RDD) phone surveys have been found to perform better than many probability-based Web surveys at including financially struggling individuals, those with low levels of education and linguistic minorities. Researchers should carefully consider the tradeoffs between measurement error on the one hand and coverage and nonresponse error on the other. Studies using both Web and telephone components – so-called mixed mode studies – may become more common, and many researchers believe that self-administration via the internet will eventually become the standard method of survey research. Pew Research Center and other scholars are currently developing methods for combining data collected from different modes so that disruption to long-standing trend data is minimized.
Methods
The mode study was conducted using the Pew Research Center’s American Trends Panel, a probability-based, nationally representative panel of US adults living in households. Respondents who self-identify as internet users (representing 89% of U.S. adults) participate in the panel via monthly self-administered Web surveys, and those who do not use the internet participate via telephone or mail. The panel is managed by Abt SRBI.
All current members of the American Trends Panel were originally recruited from the 2014 Political Polarization and Typology Survey, a large (n=10,013) national landline and cellphone random digit dial (RDD) survey conducted January 23-March 16, 2014 in English and Spanish. At the end of that survey, respondents were invited to join the panel. The invitation was extended to all respondents who use the internet (from any location) and a random subsample of respondents who do not use the internet.10
Data in this report are drawn from the July wave of the panel, which was conducted July 7-August 4, 2014 among 3,351 respondents. In this study, 50% of panelists who typically take their panel surveys via the Web were randomly assigned to take the survey via the Web mode, resulting in 1,509 Web-mode completed interviews. The remaining 50% of the Web panelists were assigned to take the survey via a telephone interview (phone mode), resulting in 1,494 experimental phone-mode completed interviews. The remaining 348 interviews were completed by non-internet panelists typically interviewed by mail. These non-experimental, phone-mode respondents are not considered in the analysis of the experiment in this report but were interviewed to calculate separate general population estimates from the data in this wave of the panel.
As outlined above, all Web panelists were included in the mode study experiment. Those with a mailing address on file were mailed a pre-notification letter, customized for their treatment group (Web vs. phone mode). The letter explained that the next monthly panel wave was a special study, and that we were attempting to obtain the highest level of participation possible. As such, respondents would be given an extra $5 for completing the study beyond their usual incentive amount of $5 or $10, depending on their incentive group. All incentives were contingent upon completing the mode study survey. The letter explained to the Web-mode panelists that an email invitation would be arriving in their inbox between July 14 and 15. The non-experimental phone-mode panelists were told the survey was being conducted via telephone for this month only and that they would hear from an interviewer in the next few days. All Web panelists were also sent a pre-notification email, customized for their treatment group. This email contained the same information as the pre-notification letter sent in the mail.
Next, panelists assigned to the Web-mode treatment were sent a standard invitation email. This was followed by up to four reminder emails for nonrespondents. Panelists assigned to the phone-mode treatment were called up to 10 times. A message was left on the first call if a voicemail or answering machine was reached. No refusal conversion was attempted on soft refusals, so as not to antagonize panelists we hoped to retain for future panel waves. After completion of the survey, respondents were sent the incentive amount referenced in their survey materials via check or Amazon gift card, according to their preference.
The ATP data were weighted in a multi-step process that begins with a base weight incorporating the respondents’ original survey selection probability and the fact that some panelists were subsampled for invitation to the panel. Next, an adjustment was made for the fact that the propensity to join the panel varied across different groups in the sample. The final step in the weighting uses an iterative technique that matches gender, age, education, race, Hispanic origin and region to parameters from the U.S. Census Bureau’s 2012 American Community Survey. Population density is weighted to match the 2010 U.S. Decennial Census. Telephone service is weighted to estimates of telephone coverage for 2014 that were projected from the July-December 2013 National Health Interview Survey. It also adjusts for party affiliation using an average of the three most recent Pew Research Center general public telephone surveys, and for internet use using as a parameter a measure from the 2014 Survey of Political Polarization. Note that for the mode study, separate weights were computed for the web respondents, the experimental phone respondents, all phone respondents (experimental and non) and the total sample. Neither the web respondent weight nor the experimental phone respondent weight included the internet usage parameter in the raking as all respondents in these groups are internet users. Sampling errors and statistical tests of significance take into account the effect of weighting. The Hispanic sample in the American Trends Panel is predominantly native born and English speaking.
The following table shows the unweighted sample sizes and the error attributable to sampling that would be expected at the 95% level of confidence for different groups in the survey:
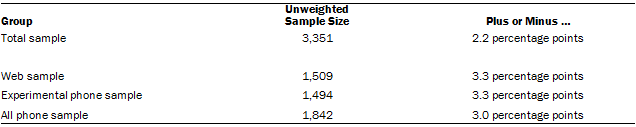
Sample sizes and sampling errors for other subgroups are available upon request.
In addition to sampling error, one should bear in mind that question wording and practical difficulties in conducting surveys can introduce error or bias into the findings of opinion polls.
The Web component of the July wave had a response rate of 64% (1,509 responses among 2,345 individuals sampled from the panel); the experimental phone component had a response rate of 63% (1,494 responses among 2,366 individuals sampled from the panel); the total phone component (experimental and non) had a response rate of 63% (1,842 responses among 2,927 Web-based and non-Web individuals sampled from the panel). Taking account of the response rate for the 2014 survey on political polarization (10.6%), the cumulative response rate for the July ATP wave is 3.7%.
Assessing the Equivalence of the Web and Phone Groups
This study was primarily designed to evaluate differences in the way people respond to questions in different modes. In order to isolate the effects of the mode of interview itself, it is essential that comparisons between the Web and telephone groups are not confounded by systematic differences in the composition of each group. Although panel members were randomly assigned to each of the groups, if one mode or the other disproportionately represents people with particular characteristics, then differences in the response patterns may be due to nonresponse rather than the measurement itself. Because all of the panel members were recruited from the same large telephone survey, we know a great deal about both the panel members who responded and those who did not. This includes their demographic characteristics as well as their partisan and ideological leanings. In this section, we will take a look at how different subgroups responded in each mode.
The overall completion rates for each mode were nearly identical, with 64% of panelists assigned to the Web group completing the survey, compared with 63% of panelists assigned to take the survey by phone. With several notable exceptions, response was largely consistent within demographic subgroups. Web and phone response did not differ significantly by age, education, marital status, income or census region. Completion varied somewhat by mode with respect to sex, race and whether the respondent lives in an urban, suburban or rural location. Women were 6 percentage points more likely to complete the survey on the Web than on the phone, whereas the completion rate for men did not differ significantly between modes.
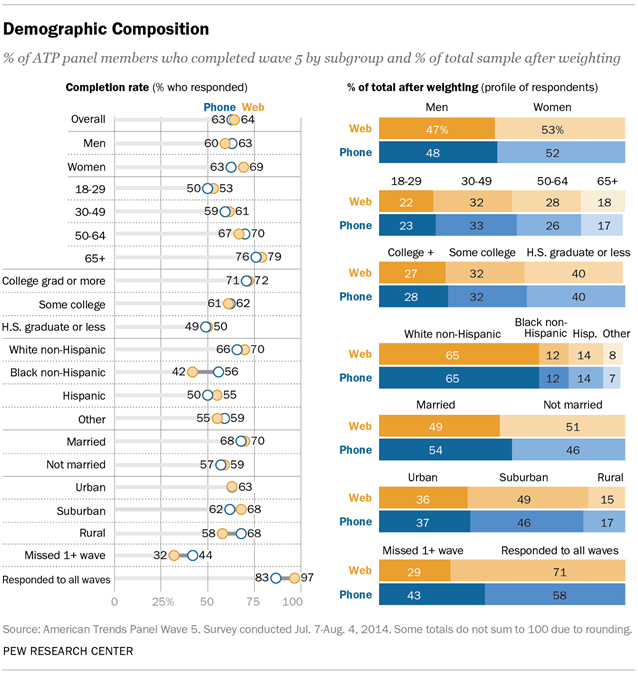
Non-Hispanic whites and Hispanics appear slightly more likely to respond in the Web group than the phone group. Non-Hispanic blacks showed the most pronounced difference, with a 56% completion rate in the phone group, compared with a 42% completion rate on the Web. Whereas urban panelists were equally likely to respond in either mode, suburban response was 6 percentage points higher on the Web, while response in rural areas was 10 percentage points higher by phone. Because the Web and phone samples are independently weighted to national parameters on all of the variables just described, the minor differences in the composition of the two groups that resulted from differential response propensities is corrected.
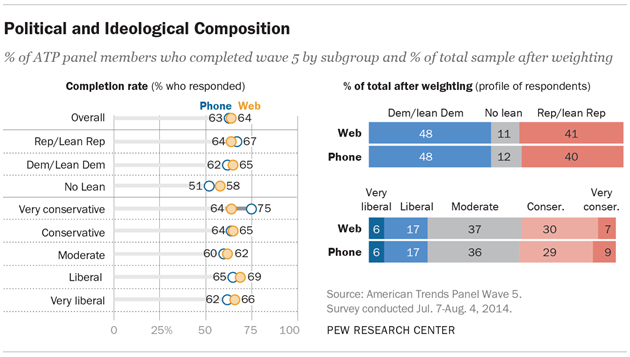
Because much of the Pew Research Center’s work relates to politics and public policy, the effects of survey design decisions on the partisan and ideological makeup of our samples is of particular importance. We do see some evidence of a mode preference along ideological lines. Panelists who identified themselves as very conservative in the recruitment survey were 11 percentage points more likely to respond if they were in the phone group. On the other end of the scale, panelists who identified as very liberal are 4 percentage points more likely to respond when in the Web group. The pattern is similar but not identical for partisanship.11 Here, Republicans and independents who lean Republican are only 2 percentage points more likely to respond in the phone group, while Democrats and those who lean Democratic are 2 percentage points more likely to respond by Web. The largest effect is found among independents who do not lean toward either party, who are 7 percentage points more likely to complete the survey in the Web group.
Despite these differences within groups in the likelihood of response, the overall demographic and partisan distributions among respondents in each mode group are remarkably similar. Prior to weighting, women make up 51% of the Web group and 49% of the phone group. Although non-Hispanic blacks were significantly more likely to complete the survey by phone, the proportion in the phone group is only 3 percentage points higher than in the Web group (9% and 6% respectively). The percentage of respondents with only a high school education or less is 4 points higher in the phone group than in the Web group. The phone group is slightly more rural, more conservative (37% very or somewhat conservative on the phone vs. 32% on the Web) and has a higher proportion of Republicans and Republican leaners than the Web group. After the groups are weighted to account for nonresponse, these differences are all largely reduced.
One sizeable difference in response that is not completely adjusted for in weighting is the regularity with which panelists responded to prior surveys. The completion rate for panelists who had responded to all three prior waves was 97% for the Web group, compared with 83% for the phone group. In the Web group, the completion rate for panelists who had missed one or more waves was 32%, compared with 44% for the phone group. This is consistent with the notion that despite all of these panelists having access to the internet, some people are easier to reach and recruit by phone than Web. After weighting, 29% of the Web group had missed one or more prior waves, compared with 43% in the phone group.
Despite this difference, the demographic distributions of the two experimental groups remain quite similar. Moreover, we repeated several of our analyses while controlling for the effects of response to previous waves, and our findings with and without these controls were very similar. The sole exception involved questions on internet use and technology. The Web-mode respondents were more likely to report using the internet “constantly” than the phone respondents, possibly because people who are more frequent internet users are also more likely to respond to a Web-based survey invitation. The telephone sample brought in respondents who are less frequent internet users and therefore less likely to respond to a Web-based survey invitation. In more technical terms, there appears to be a strong, direct association between the response mechanism and outcomes pertaining to frequency of internet use.
For Further Reading
Chang, L. and J. A. Krosnick. 2009. “National Surveys via RDD Telephone Interviewing Versus the Internet.” Public Opinion Quarterly, pages 641–678.
Groves, Robert M. and Robert L. Kahn. 1979. “Surveys by Telephone: A National Comparison with Personal Interviews.” Academic Press.
Kreuter, Frauke, Stanley Presser and Roger Tourangeau. 2008. “Social Desirability Bias in CATI, IVR, and Web Surveys the Effects of Mode and Question Sensitivity.” Public Opinion Quarterly.
Kolenikov, Stanislav and Courtney Kennedy. 2014. “Evaluating Three Approaches to Statistically Adjust For Mode Effects.” Journal of Survey Statistics and Methodology.
Presser, Stanley and Linda Stinson. 1998. “Data Collection Mode and Social Desirability Bias in Self-Reported Religious Attendance.” American Sociological Review.
Tourangeau, Roger, Frederick G. Conrad and Mick P. Couper. 2013. “The Science of Web Surveys.” Oxford University Press.
Tourangeau, Roger and Tom W. Smith. 1996. “Asking Sensitive Questions: The Impact of Data-Collection Mode, Question Format, and Question Context.” Public Opinion Quarterly.


