
The U.S. Hispanic population reached 57 million in 2015, but a drop-off in immigration from Latin America and a declining birth rate among Hispanic women has curbed overall growth of the population and slowed the dispersion of Hispanics through the U.S.
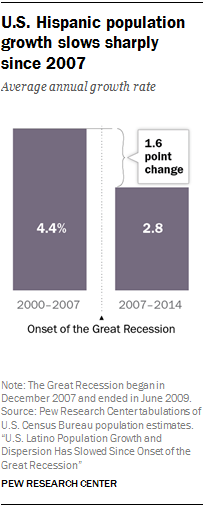
From the onset of the Great Recession in 2007 through 2014, the U.S. Hispanic population had an annual average growth rate of 2.8%, compared with an average 4.4% growth each year from 2000 to 2007. As a result, in terms of growth rate, Hispanics – once the nation’s fastest-growing population – have now slipped behind Asians, whose population grew at an average annual rate of 3.4% between 2007 and 2014.
Here are key takeaways from our new report on the geography of the U.S. Hispanic population, which includes fact sheets and interactive county, metropolitan and state maps. (Data on Hispanic eligible voters are available in our state and congressional district interactives and fact sheets.)
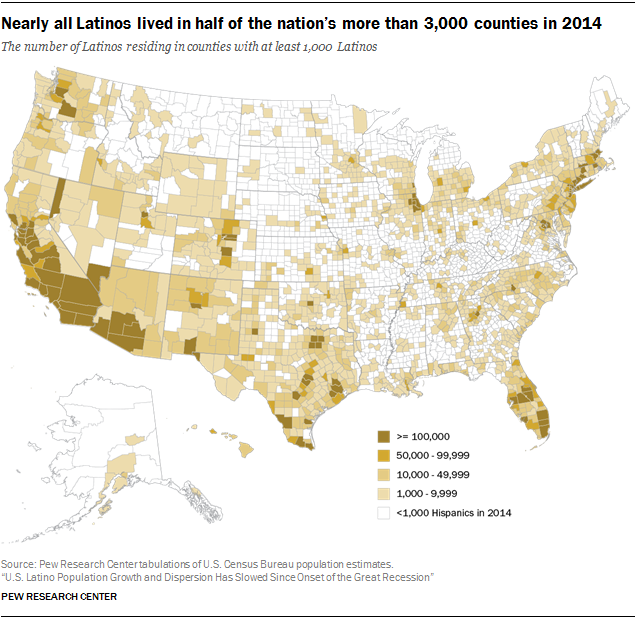
Despite slowing growth rates, Latinos still accounted for more than half (54%) of total U.S. population growth from 2000 to 2014. Hispanics drove at least half of overall population growth in 524 counties that had at least 1,000 Latinos in 2014. In these counties, Hispanic population growth accounted for 54% or more of total growth. The South accounted for 46% of these counties, compared with 24% in the West, 18% in the Midwest and 12% in the Northeast.
The dispersion of the Latino population across the U.S. has slowed since the onset of the Great Recession. In 2014, half of the nation’s counties had at least 1,000 Hispanics, a 4-percentage-point increase from 2007. But dispersion was more widespread from 2000 to 2007, when this share increased from 38% to 46% of all U.S. counties – an 8-percentage-point increase.
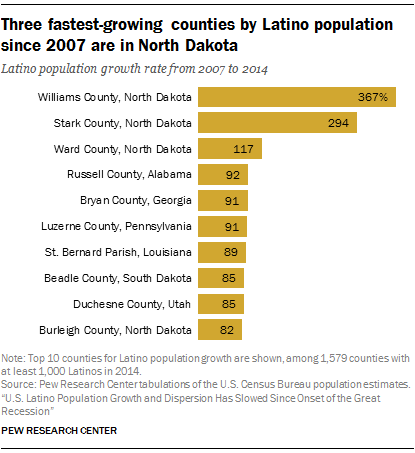
In recent years, the fastest Latino population growth has tended to come in areas with a relatively small number of Latinos. Three counties in North Dakota had the fastest growth in Latino population from 2007 to 2014. During this time, North Dakota added thousands of workers thanks to a boom in Bakken shale oil production. This Hispanic population surge may be a shift away from the South, which had eight of the 10 fastest-growing Hispanic county populations from 2000 to 2007. Even so, the South remains the largest source of growth, accounting for 43% of U.S. Hispanic population growth from 2007 to 2014.
The Hispanic population is not growing in every county of the United States. The Latino population declined in 38 counties with at least 1,000 Latinos in 2014, and most of these declines were in Texas, Colorado and New Mexico – states that have large and well-established Latino populations. Many of these counties are located in non-metropolitan areas. For example, in Texas, Culberson County’s Latino population declined from 2007 to 2014 by 15% to 1,665, the largest drop in the nation. Saguache County in Colorado had the second-fastest decline in its Latino population during this period, dropping by 14% to 2,370.
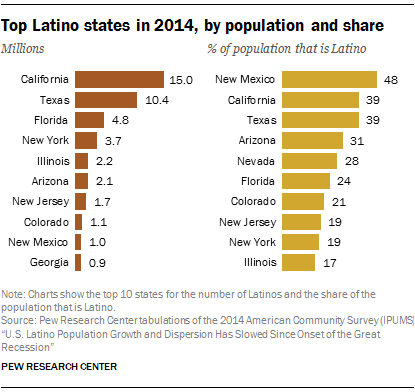
California continues to have the nation’s largest Latino population among states, but Texas has grown faster. In 2014, 15 million Hispanics lived in California, a 37% increase from the 10.9 million Hispanics in 2000. Texas saw even quicker growth, with its Hispanic population increasing 56%, from 6.7 million in 2000 to 10.4 million in 2014.
More than half (53%) of the nation’s Hispanics lived in 15 metropolitan areas in 2014. Los Angeles-Long Beach-Anaheim topped the list with 6 million Hispanics in 2014, a majority of whom are U.S. born, as is the case in most of these metro areas. Immigrants made up the majority in two of the top 15: In Florida’s Miami-Fort Lauderdale-West Palm Beach, 61% of 2.6 million Hispanics were foreign born in 2014, while in Washington-Arlington-Alexandria (which includes the District of Columbia and parts of Virginia, Maryland and West Virginia), 53% of 900,000 Hispanics are foreign born.
