
College is a pretty pricey proposition, even after grants and scholarships are factored in. And the millions of students graduating this spring will soon learn just how expensive their degrees were when they start getting student-loan bills.
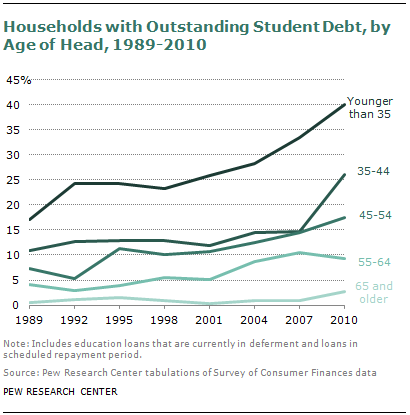
As a Pew Research Center analysis noted last year, nearly one in five U.S. households (19%) owed money on student loans in 2010, more than double the proportion in 1989. Among households headed by someone younger than 35 (i.e., people more likely to be recent college graduates), a record 40% had student-loan debt outstanding.
The average student loan balance outstanding in 2010 was $26,682, but 10% of student debtors owed more than $61,894. (Pew Research derived those numbers from the Survey of Consumer Finances, conducted every three years by the Federal Reserve Board.)
Somewhat older data from the National Postsecondary Student Aid Study (analyzed by both Pew Research and the College Board) breaks down debt levels by type of institution and degree. As of the 2007-08 academic year, for instance, 25% of students who earned bachelor’s degrees from private nonprofit colleges carried more than $30,000 in debt, compared with 12% of public-college graduates and a remarkable 57% of graduates of private, for-profit schools.

According to the College Board, loans from all sources accounted for 40.4% of the $191.8 billion spent on financing undergraduate education in 2011-12. Grants from all sources accounted for 50.6%, with education tax benefits and work-study making up the rest.
The College Board figures exclude whatever students and their families pay from their own resources. But according to 2009 data from the Organization for Economic Cooperation and Development, the United States ranked fifth among 31 major countries studied in terms of reliance on households for funding higher education: 45.3% of total expenditures, trailing Chile, the United Kingdom, Japan and South Korea. (Although three countries — Denmark, Finland and Germany — didn’t separate households from other private-sector funding sources, their total private-funding percentages were well below the U.S.)
On average, public sources accounted for about 70% of total higher-ed expenditures in the 31 countries studied by the OECD, versus 38% in the United States.
