by Jodie T. Allen, Senior Editor, Pew Research Center
Were confirmation needed that the American public is in a sour mood, the 2010 midterm elections provided it. As both pre-election and post-election surveys made clear, Americans are not only strongly dissatisfied with the state of the economy and the direction in which the country is headed, but with government efforts to improve them. As the Pew Research Center’s analysis of exit poll data concluded, “the outcome of this year’s election represented a repudiation of the political status quo…. Fully 74% said they were either angry or dissatisfied with the federal government, and 73% disapproved of the job Congress is doing.”
This outlook is in interesting contrast with many of the public’s views during the Great Depression of the 1930s, not only on economic, political and social issues, but also on the role of government in addressing them.
Quite unlike today’s public, what Depression-era Americans wanted from their government was, on many counts, more not less. And despite their far more dire economic straits, they remained more optimistic than today’s public. Nor did average Americans then turn their ire upon their Groton-Harvard-educated president — this despite his failure, over his first term in office, to bring a swift end to their hardship. FDR had his detractors but these tended to be fellow members of the social and economic elite.
Still, as now, the public had some reservations about the stretch of government power and found little consensus on specific policies with which to tackle the nation’s troubles.
Optimistic ‘Socialists’
Broadly representative measures of public opinion during the first years of the Depression are not available — the Gallup organization did not begin its regular polling operations until 1935. And in its early years of polling, Gallup asked few questions directly comparable with today’s more standardized sets. Moreover, its samples were heavily male, relatively well off and overwhelmingly white.
However, a combined data set of Gallup polls for the years 1936 and1937, made available by the Roper Center, provides insight into the significant differences, but also notable similarities, between public opinion then and now.1
Bear in mind that while unemployment had receded from its 1933 peak, estimated at 24.9% by the economist Stanley Lebergott,2 it was still nearly 17% in 1936 and 14% in 1937.3 By contrast, today’s unemployment situation is far less dismal. To be sure, despite substantial job gains in October, unemployment remains stubbornly high relative to the norm of recent decades and the ranks of the long-term unemployed have risen sharply in recent months. But the current 9.8% official government rate, as painful as it is to jobless workers and their families, remains far below the levels that prevailed during most of the 1930s.
Still, despite their far higher and longer-lasting record of unemployment, Depression-era Americans remained hopeful for the future. About half (50%) expected general business conditions to improve over the next six months, while only 29% expected a worsening. And fully 60% thought that opportunities for getting ahead were better (45%) or at least as good (15%) as in their father’s day.
Today’s public is far gloomier about the economic outlook: Only 35% in an October Pew Research Center survey expected better economic conditions by October 2011, while 16% expected a still weaker economy. The Reagan-era recession found the public somewhat more hopeful than at present, but less optimistic than in the 1930s.4 In November 1982, with unemployment at its recession peak of nearly 11%, Americans believed their personal financial situation would improve over the next year by a 41%-to-22% margin.
However, the most striking difference between the 1930s and the present day is that, by the standards of today’s political parlance, average Americans of the mid-1930s revealed downright “socialistic” tendencies in many of their views about the proper role of government.
True, when asked to describe their political position, fewer than 2% of those surveyed were ready to describe themselves as “socialist” rather than as Republican, Democratic or independent. But by a lopsided margin of 54% to 34%, they expressed the opinion that if there were another depression (and fears of one were mounting), the government should follow the same spending pattern as FDR’s administration had followed before.
And, those surveyed said they supported Roosevelt, the architect of the New Deal’s expansive programs, over his 1936 Republican opponent, Alfred Landon by more than two-to-one (62%-30%).5
Pro-Government Preferences …
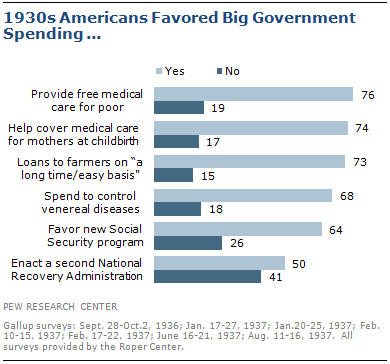
Among policies approved by roughly two-in-three in 1936-7, was the new Social Security program — this despite the fact that the questions asked about it focused on the compulsory equal monthly contributions by employers and employees rather than on any promised benefits at retirement.
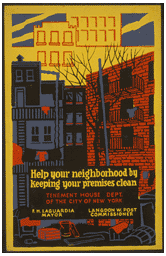
Large majorities favored the federal government providing free medical care for those unable to pay (76%), helping state and local governments cover the costs of medical care for mothers at childbirth (74%), spending $25 million (big
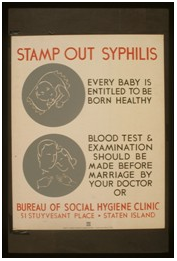
bucks in those days) to control venereal diseases (68%), and giving loans on “a long time and easy basis” to enable tenant farmers to buy the farms they then rented (73%).
Moreover, a 46%-plurality favored concentration of power in the federal, rather than state government (34% favored the latter).
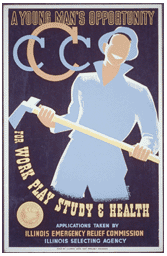
Of course, the New Deal had many vocal critics. A favorite target was the WPA, the employer of some eight million workers over its eight-year lifetime.
Although these workers somehow managed to build such enduring monuments as La Guardia and Washington (now Reagan) National airports, Grand Coulee Dam, the Outer Drive in Chicago, San Francisco’s Bay Bridge and New York’s Triborough Bridge, as well as parks, schools, playgrounds, overpasses, golf courses and airfields scattered across the country,
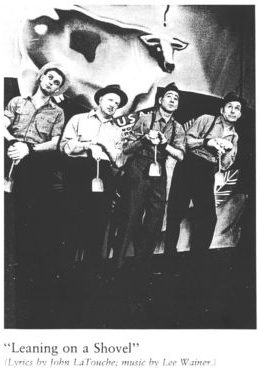
they were featured in many a cartoon as passing their time leaning on their shovels.6 In response, the WPA Theatre project produced a play satirizing that common criticism (see photo at right).
Some contemporaneous complaints have a familiar ring. In a 1935 radio broadcast, the president of the New York Economic Council saw it this way: “This, of course, is nothing but the same old European and Asiatic tyranny from which our ancestors fled Europe in order to establish real freedom.”
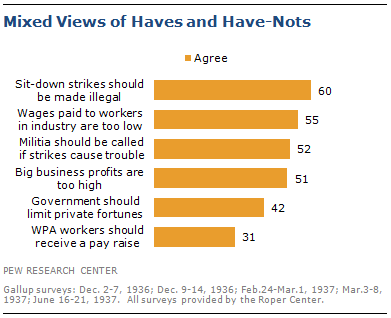
But this was not the majority view. Half of the public even supported enactment of a second NRA (National Recovery Administration), the New Deal agency declared unconstitutional by a Supreme Court that aimed to reduce “destructive competition” by encouraging industry agreements and wage and hour protections for workers. Also, a 55%-majority thought that the wages paid to workers in industry were too low, while half said that big business concerns were raking in too much profit.
And Ready to Regulate …
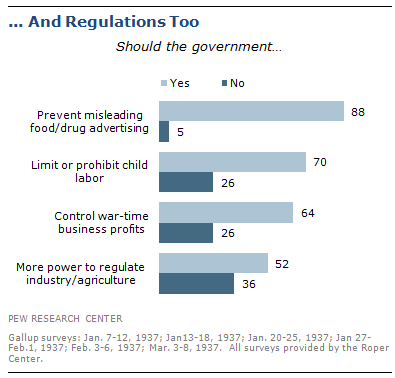
Statist views were not limited to support for government spending. Major regulatory programs also received strong endorsements: Fully 70% favored limitations and prohibitions on child labor, even if that required amending the Constitution. Even more (88%) endorsed a law that would prevent misleading food, cosmetic and drug advertising. By 52% to 36%, the public also supported an amendment that would allow greater congressional regulation of industry and agriculture — and, at least in war-time, federal control of “all profits from business and industry” was favored by a 64%-to-26% margin.
Perhaps the sharpest departure from today’s prevailing ethos is that, by a lopsided 59%-to-29% margin, Americans then said they would prefer public rather than private ownership of the electric power industry! Even more (69%) gave a thumbs-up to a takeover of the war munitions industry.
… But Only Up to a Point
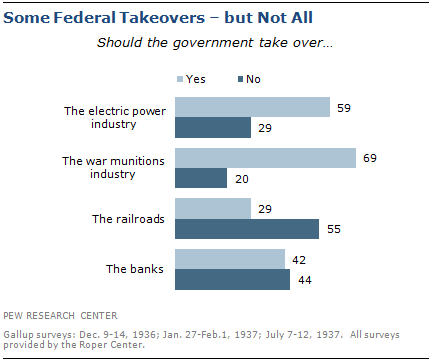
Still, even then there were limits on the appetite for government takeovers. By a 55%-to-29% margin, the public rejected public ownership of the railroads and split 42%-44% on the question of government ownership of the banks (though a 48%-plurality expected that sooner or later that would happen.)
Indeed, when asked if they had to make the choice would they opt for fascism or communism, the public expressed a substantial preference for fascism (39%) over communism (25%), while 36% offered no opinion. (When the question was phrased in terms of living under a German- versus a Russian-type government, the public showed a similar preference for the German model.
Moreover, despite widespread deprivation far beyond anything experienced in modern-day America, by a margin of 50%-to-42%, Americans in the mid-1930s rejected the idea of government limiting the size of private fortunes.
Nor was the public was ready to give organized labor a wholehearted embrace. Only 10% said they belonged to a union, and, during the 1936-1937 General Motors strike, only a third said their sympathy lay with the strikers, while 41% sided with the employers. What’s more, fully 60% supported the passage of state laws making sit-down strikes illegal, and about the same proportion favored forceful intervention by state and local authorities; half would call out the militia if strike trouble threatened.
In this dim view of unions, the 1930s public finds company among today’s voters. As Andrew Kohut describes in a recent analysis in the New York Times, the majority support that unions had come to enjoy has faded sharply since 2007. In a February 2010 Pew Research survey, only 41% of the public expresses a favorable opinion of organized labor, down from 58% three years earlier.
Support for assistance programs was also waning somewhat by 1937. A 53%-majority expressed support for “the government’s policy of reducing relief expenditures at this time,” while opinion was split on whether farm benefits should be increased (39%), decreased (31%) or left the same (31%). Relatively few (25%) were ready to decrease soldiers’ pensions but only 24% wanted to see them increased.
This weakening of support for government spending was no doubt tied to concern over the buildup of federal debt. Government borrowing had not yet exploded to the still-unmatched levels relative to the size of the economy seen during World War II, but New Deal stimulus spending had pushed the federal debt to 40% of GDP by 1933, a level around which it hovered throughout the remainder of the decade.
At the time of the November 1936 election, a solid 65%-majority said that it was necessary for the new administration to balance the budget – though 62% also thought that was Congress’s responsibility rather than the president’s. To that end, many were even ready to raise some taxes: Nearly half (45%) supported a sales tax in their state to raise revenue. Also, by a 49%-to-32% margin, the public favored taxing income from federal bonds, a levy that would, presumably, fall most heavily on well-to-do coupon-clippers.
When it came to the spending side of the federal balance sheet, however, they like today’s voters, shied away from specificity. Fully 70% signed on to a decrease in “general government running expenses,” that era’s likely equivalent of today’s “fraud, waste and abuse.” Still, as now, that consensus wobbled when the question got down to the specific consequences of spending cuts. About half opted for unspecified cuts in relief programs, and relatively few (31%) thought WPA workers should get a pay raise. But no more than 28% thought relief workers should be dropped from the program before they had found jobs in private industry. And 67% acknowledged finding work outside of the WPA would be hard to do.
… And Not About to Coronate
His popularity notwithstanding, America was not prepared to enthrone its leader in the White House. The public was divided as to whether Congress should give Roosevelt the power to enlarge the cabinet and reorganize government. The same was true of FDR’s plan to “pack” the Supreme Court so as to increase its liberal membership.
Only a third (34%) then favored the third term for Roosevelt that he subsequently won. (In the throes of the deep 1981-82 recession, a nearly identical minority, 36%, wanted Reagan to seek a second term.7 By comparison, despite seemingly intractable unemployment, a 47%-plurality still wants President Obama to run in 2012.)
Nor was the Grapes-of-Wrath era public totally forgiving. In 1938, after previously declining unemployment took a sharp upward turn, Democrats lost 7 seats in the Senate and a still record-setting total of 72 seats in the House. In the 1982 midterm elections, Republicans lost 26 seats in the House, strengthening the Democratic majority, though Republicans retained control of the Senate, not losing a single seat. Of course, two years after these setbacks for their parties, voters returned both Reagan and Roosevelt to the White House.
How Different a World?
More mundane differences than the absence of dust bowls, migrating Okies, and starving sharecroppers separate today’s American landscape from that of the 1930s. There was TVA — but no TV. And, of course, there was no internet. More than half of the 66%-male, 98%-white sample surveyed by Gallup in 1936-37 had average or above average incomes; only 10% were on relief. But 46% had no telephone and 43% lacked a car. And while most (82%) frequented the movies, 38% still preferred the old black-and-white variety to color.
Train was the preferred mode of travel on a long trip, handily beating out planes, cars and the bus. And despite active efforts by the aviation industry to encourage passengers (including the introduction of female stewardesses and the introduction in 1936 of a “buy now, pay later” discounted ticket plan that will seem familiar to modern-day consumers), as well as participant-friendly air shows in localities across the nation, two out of three among those surveyed had never traveled in an airplane. And most didn’t want to: Six-in-ten (61%) said that even if someone paid their full expenses, they still wouldn’t want to go by airplane to Europe and back, whereas 80% would gladly accept the deal if they could go by boat.
But for all their differences in day-to-day experience — not to mention their views of government — Americans in the 1930s shared attitudes with many of today’s voters that extend beyond their low opinion of unions and their non-specific worry about federal debt.
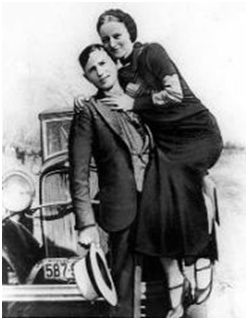
The Bonnie-and-Clyde/John Dillinger era of celebrity gangsters had ended a couple of years earlier and in 1936-7, Americans were generally as tough on crime as they are now: 60% favored the death penalty — though among these only a quarter supported capital punishment for persons younger than age 21.
Three-in-four (74%) thought parole boards should be stricter. And almost everyone (86%) wanted jail sentences for drunken drivers. Still, most (54%) favored giving more attention to prisoners’ occupational training, rather than dealing with them more severely (22%).
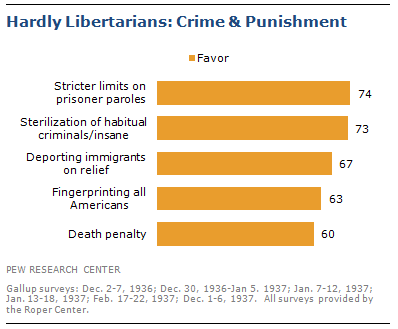
As now, Americans in the 1930s worried about immigrants, whether legal or not, taking jobs from native-born Americans: Two in three thought “aliens on relief” should be sent back to their “own countries.”
With domestic problems so pressing, few were interested in the United States taking on foreign obligations. A striking 64% called it a mistake for the U.S. to have entered World War I, despite its victory, and by two to one (53%-26%), they still rejected U.S. membership in the League of Nations. Furthermore, to make it hard for the country to get involved in another massive conflict, not only did they assume the now all-but-nullified constitutional requirement that Congress should declare war, nearly seven-in-ten (68%) thought Congress should first be required to “obtain the approval of the people by means of a national vote.”
In today’s global economy, the U.S. public is far more internationally minded. Still, as in the 1930s, isolationist tendencies have cropped up. In a December 2009 Pew Research poll, nearly half (49%) said that the United States should “mind its own business internationally and let other countries get along the best they can on their own. ” In addition, 44% agreed that “the U.S. should go our own way in international matters,” a record level since Gallup first asked the question in 1964. This year, a pre-election survey found jobs and health care were the runaway top issues among likely voters; Afghanistan or terrorism ranked at the very bottom of a list of six possible issues.
Back then, people were generally supportive of a free press. More than half (52%) agreed that “the press should have the right to say ANYTHING it pleases about public officials” — with the emphasis supplied in the Gallup question.
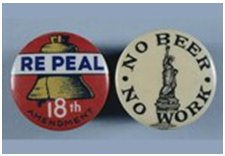
Three years after the repeal of Prohibition in 1933, few (29%) said they would vote to “make the country dry” again.
But these were far from thorough-going libertarians. Though identity theft and terrorists boarding planes were absent from the citizenry’s list of concerns in the mid-thirties, by a 63%-to-29% margin, the public favored a requirement that everyone in the United States be fingerprinted, a proportion remarkably close to the 57% who favored a national identity card when a Pew Research Center survey last tested this issue at the close of 2006.
More strikingly, nearly three-quarters of the U.S. public (73%) favored sterilization of habitual criminals and the hopelessly insane, a view now considered so retrograde that pollsters no longer even inquire about it.
The “birth control movement,” which might be viewed as either a libertarian freedom-to-choose cause or an authoritarian population-control effort, depending on one’s point of view, drew strong 61%-to-26% support.
Views on civil rights were evolving, but slowly. Six in ten said Congress should make lynching a federal crime. Two-thirds thought it was acceptable to have women serve on juries in their state. Moreover, among those favoring the death penalty, fully 77% were ready to give women equal opportunity for the scaffold or electric chair. But while a 60%-majority was ready to vote for a well-qualified Catholic for president, and the surveyed public split evenly (46%-47%) on the choice of a Jew, only a third (33%) would send a woman to the Oval Office, even if she “were qualified in every other respect.” The possibility of a black president was apparently so remote that Gallup didn’t bother to test public reaction.
And in Conclusion …
Is there a message in this for today’s America? Two possible lessons: First, it’s worth remembering that the social programs and banking controls that the New Deal era produced stood the nation in good stead over many decades of unprecedented prosperity. Second, Depression-era Americans’ faith in the country and its guiding institutions steeled them against the challenges of a double-dip recession and, years later, World War II. They had it worse, but they also expected it to get better, faster.
Learn how early 1980s Americans responded to their deep economic downturn in an accompanying commentary: “Reagan’s Recession“
1. The Gallup poll samples are drawn from 21 individual surveys conducted nationally and reweighted to conform to population demographics The Roper Center’s provides the following description of survey methodology and their additional “cleaning” efforts to make the data consistent and representative across surveys.
General Information:
This data set is made up of 21 individual surveys. They were conducted during the years 1936 and 1937 by the American Institute of Public Opinion. There are a total of 63,052 records in the file. The actual study numbers and their corresponding N’s are presented below:
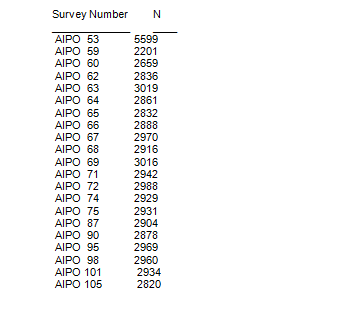
Survey N’s do NOT represent the “true” number of persons interviewed. As was the custom in the early days of data processing, a “card” weighting procedure was used to make the samples conform to population parameters. Instead of creation of a “weight” variable (which serves as a multiplication factor) individual response records were simply duplicated. The data from the surveys were processed according to standard Roper Center procedures. Cleaning procedures (converting from multi-punch formats to characters formats) were performed so as to preserve the integrity of the original survey instruments. Certain variables have been recoded from their “single” survey forms to insure cross- study consistency. This cumulative data set merges all 21surveys into a single data set with repeated questions across surveys defines as the same variables. The survey identification variable serves as a means for specific survey identification. Missing data codes have been established for questions not asked in the various surveys. The surveys included for each question are documented in “notes” after each question in the following codebook. Sampling Technique: Modified Probability. Prior to 1950, the samples for all Gallup surveys, excluding special surveys, were a combination of what is known as a purposive design for the selection of cities, towns, and rural areas, and the quota method for the selection of individuals within such selected areas. these were distributed by six regions and five or six city size, urban rural groups or strata in proportion to the distribution of the population of voting age by these regional-city size strata. The distribution of cases between the non-south and south, however, was on the basis of the vote in Presidential elections. Within each region the sample of such places was drawn separately for each of the larger states and for groups of smaller states. The places were selected to provide broad geographic distribution within states and at the same time in combination to be politically representative of the state or group of states in terms of three previous elections. Specifically they were selected so that in combination they matched the state vote for three previous elections within small tolerances. Great emphasis was placed on election data as a control in the era from 1935 to 1950. Within the civil divisions in the sample, respondents were selected on the basis of age, sex and socio-economic quotas. Otherwise, interviewers were given considerable latitude within the sample areas, being permitted to draw their cases from households and from persons on the street anywhere in the community. 2. The BLS did not begin producing official estimates of unemployment until 1940, but the estimates produced by Lebergott are well-regarded within the academic community. Lebergott, however, includes WPA and other work relief participants among the unemployed. By counting these workers as employed, economist Michael Darby reduces the 1933 peak to 20.6%. 3. If WPA and other work-relief workers are counted among the employed, the unemployment rate is estimated to have been reduced to 10% in 1936 and 9% in 1937. 4. For a more detailed description of public opinion during the 1981-1982 recession, see “Reagan’s Recession.” 5. Averaged over both pre- and post-election surveys. 6. A blog of Americana recounts one typical joke of the era: A motorist honored the stop sign preceding a curve in the road, in which you couldn’t see the end of the curve. A W.P.A. worker was there to advise the motorists — but he had laryngitis and had to speak in a raspy whisper. He said: “Be careful, there’s W.P.A.workers around the bend.” The motorist spoke back to the man, using the same raspy, whispering, voice – “Don’t worry – I WON’T WAKE ‘EM UP!!” 7. For a more detailed description of public opinion during the 1981-1982 recession, see “Reagan’s Recession.”