
The data in this report comes from a self-administered web survey of K-12 public school teachers in the United States. It was conducted online in English from Oct. 17 to Nov. 14, 2023. Out of 6,357 teachers who were sampled, 191 were screened out as no longer eligible. A total of 2,531 completed the survey, for a completion rate of 41.0%. The margin of sampling error for the full sample of 2,531 teachers is plus or minus 2.4 percentage points. The survey was administered by RAND on its American Teacher Panel, a nationally representative panel of public K-12 teachers.
The American Teacher Panel is recruited through probability-based methods from a commercially available list of U.S. public school teachers. The sampling frame for recruiting teachers to the panel was acquired from MDR Education. It is intended to be as comprehensive as possible, yet likely underrepresents new teachers, or experienced teachers new to a school or district. The American Teacher Panel began in 2014 and currently includes more than 25,000 teachers. Teachers recruited to the American Teacher Panel have agreed to participate in online surveys several times per school year and receive incentives for completing surveys.
Teachers selected to join the American Teacher Panel are first sent an invitation packet via FedEx that includes a prepaid $10 gift card as an incentive. Reminder emails are sent to nonrespondents whose contact information includes an email address. The American Teacher Panel has an overall empanelment rate of 30%. Read additional details about the American Teacher Panel’s design and methodology.
Sample design
The target population for this survey was K-12 public school teachers in the United States. A total of 6,357 teachers were invited to participate in this survey. This includes an initial sample of 5,000 teachers and a supplementary sample of 1,361 teachers that was later drawn to achieve the targeted sample size of 2,500 completed interviews. Because teachers are invited to join the American Teacher Panel at varying rates, each teacher’s probability of selection for this survey was inversely proportional to their estimated probability of membership in the American Teacher Panel. This is done so that each teacher has approximately equal probabilities of having both joined the American Teacher Panel and been selected for this survey.
Data collection protocol
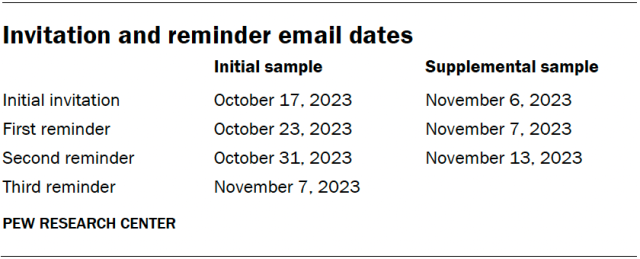
The field period for this survey was Oct. 17-Nov. 14, 2023. After an initial invitation email, nonresponding teachers in the initial sample received up to three reminder emails. Nonrespondents in the supplemental sample received up to two reminder emails.
Weighting
The data was weighted in a multistep process that accounts for multiple stages of sampling and nonresponse that occur at different points in the survey process. Every American Teacher Panel member begins with a design weight that accounts for their initial probability of selection for their recruitment survey. That weight is further calibrated so that the composition of the entire panel aligns with that of the national population of public school teachers based on data from the National Center for Education Statistics on a combination of school and teacher characteristics.
Weighting parameters for the following school-level characteristics are based on the 2021-2022 Common Core of Data (CCD):
- School level
- School percent free and reduced-price lunch
- School percent minority
- School size
- School locale
Weighting parameters for the following teacher-level characteristics are based on the 2020-2021 National Teacher and Principal Survey (NTPS):
- Teacher gender
- Teacher race
- Teacher experience
Among respondents, this weight is first adjusted to account for each teacher’s probability of selection for this wave. A second adjustment is then applied to account for each respondent’s probability of completing the survey after having been selected. This probability is estimated based on teacher and school characteristics using a model. In a third step, the nonresponse-adjusted weights are once again calibrated so that the composition of the sample aligns with that of the target population based on the weighting parameters listed above. Finally, the weights were trimmed at the 95th percentile to reduce the loss in precision stemming from variance in the weights.
The following table shows the unweighted sample sizes and the error attributable to sampling that would be expected at the 95% level of confidence for different groups in the survey.
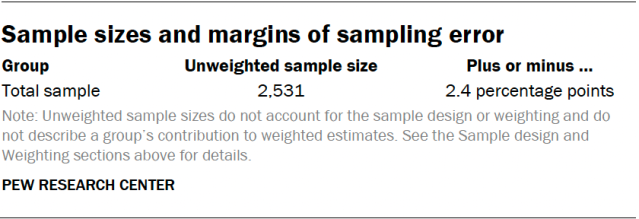
Sample sizes and sampling errors for other subgroups are available upon request. In addition to sampling error, one should bear in mind that question wording and practical difficulties in conducting surveys can introduce error or bias into their findings.
School characteristics
The American Teacher Panel includes NCES school ID codes which allowed us to match the teachers surveyed to their school characteristics provided by NCES’s Common Core of Data. Data on the following school characteristics are based on those reported by the NCES: school level (elementary, middle or high), school size, location, poverty level (based on percentage students eligible for free and reduced-price lunch) and student demographics.
