Secondary data analysis
The estimates of labor market trends in this report are derived from Current Population Survey (CPS) data. Conducted jointly by the U.S. Census Bureau and the Bureau of Labor Statistics, the CPS is a monthly survey of about 60,000 households and is the source of the nation’s official statistics on unemployment. The COVID-19 outbreak affected data collection efforts by the U.S. government in its surveys, especially in 2020 and 2021, limiting in-person data collection and affecting the response rate. It is possible that some measures of economic outcomes and how they vary across demographic groups are affected by these changes in data collection.
The CPS microdata used in this analysis are the Public Use Microdata Files released by the Census Bureau. The specific files are for the months of January 2019 to March 2022.
The employer-switching rate
Estimates of the rates at which workers switched employers from one month to the next are based on the following question asked each month in the CPS:
PUIODP1: Last month, it was reported that your worked for (employer’s name). Do you still work for (employer’s name) (at your main job)?
The universe for this question includes employed workers who were also interviewed in the previous month. That represents about 75% of employed workers in any given month.
Estimates of employer switching are derived from the monthly cross-section files. Most of the estimates are based on the annual average of monthly counts of workers who reported changing or not changing employers. Some estimates are simple three-month moving averages of monthly estimates of the shares changing employers.
Longitudinal analysis
The CPS data have the characteristic that, in principle, about three-quarters of the people interviewed in one month are also interviewed in the next month. Much of the analysis exploits this feature to study the monthly transitions of workers from, say, employment to unemployment or from one industry to another. Similarly, about half the people interviewed in one year are also interviewed in the same month next year. Earnings data are only available for these workers and the matching of CPS files from year to year is used to examine the 12-month change in their earnings.
These aspects of the analysis call for the matching of the records of individuals from month to month or from year to year. The matching is based on household identification variables included in the CPS, a person’s relationship to the reference person, the line number of the person’s record within the household, and state of residence. Additional edits were imposed to ensure that respondents who were matched were of the same sex, race and nativity. Age was allowed to advance by one year for month-to-month matches and up to two years for year-to-year matches. See the guidance provided by the National Bureau of Economic Research (NBER) for more on the matching of CPS data over time.
In the longitudinal analysis, the estimates for 2019 are based on 11 months of matched files, from January-February 2019 through November-December 2019. Estimates for 2020 and 2021 are based on 12 months of matched files. For example, the estimates for 2020 include the December 2019-January 2020 matched file. Estimates for 2022 are based on three matched files, starting with December 2021-January 2022 and ending with February-March 2022.
The monthly estimates from the matched files use the longitudinal weight in the CPS for the second of the two months in the pair. The year-to-year longitudinal estimates use the outgoing rotation weight from the CPS. It should be noted that longitudinal analyses may be subject to attrition bias, the result of respondents exiting the sample prior to their second or subsequent rounds of interviews, perhaps because of an address change. For example, if it is the case that workers switching employers are more likely to leave the CPS sample that would tend to lower the estimated rate of employer switching.
Workers who were employed one month may be employed, unemployed or not in the labor force the next month. Those who are employed in both months are additionally separated into two groups – those who changed employers and those who did not. This separation is based on the employer-switching rate estimated as described above. Because the sample in the longitudinal files differs from the sample in the cross-section files, the resulting estimate of the employer-switching rate may also be different. For example, using the monthly longitudinal files, the average monthly rate of employer-switching in 2021 is estimated to be 2.0%. But, using the cross-section files, the average monthly rate of employer-switching in 2021 is estimated to be 2.3%. The lower rate of employer switching in the longitudinal files suggests that workers who make the switch are more likely to be among those who bowed out of the CPS sample.
Industry and occupation
The industry groups used in this analysis are based on the detailed industries (PRDTIND1) listed in the CPS. The 51 detailed industries identified in the CPS, excluding Armed Forces, are regrouped into 18 categories for use in this analysis. For example, nine durable goods manufacturing industries are grouped into a single durable goods manufacturing category. The occupation categories in this analysis are the same as the 22 detailed occupations (PRDTOCC1) listed in the CPS (excluding Armed Forces).
Because of changes to the CPS occupation and industry classifications in January 2020, estimates of the shares of workers changing occupation or industry do not include the period from December 2019 to January 2020.
The estimates of the rates at which workers moved across industries or occupations are adjusted for missing information on employer switching. In 2019, for example, 3.7% of workers overall who were employed in both months were estimated to have switched industries. But among workers with information on whether they changed employers, only 1.4% reported a change in industry. This skew resulted from the fact that records of workers reporting an industry change disproportionately lacked information on whether they changed employers. To correct for this skew, cases with data on industry of employment in both periods but not on employer change were assumed to have switched employers at the same rate as workers overall, 2.0% in an average month in the matched data files for 2019. This boosted the rate of industry switching among workers with information on whether they changed employers from 1.4% to 3.7%. The post-estimation procedure changed the rate of industry switching among job stayers from 0.4% to 2.9%. The rate of movement across industries among job switchers changed from 49.5% to 47.4%.
Estimating the change in earnings
Wages are adjusted for inflation with the Consumer Price Index for All Urban Consumers (CPI-U) as published by the U.S. Bureau of Labor Statistics (BLS).
In the analysis of changes in earning from one year to the next, job switchers are workers who reported changing employers in the last month. For example, consider a worker who was present in the CPS sample in both March 2021 and March 2022. The change in earnings for this worker is based on their reported wages in March 2021 and March 2022, adjusted for inflation. They are additionally classified as job switchers if they also reported a change in employer from February to March 2022.
Because the CPS asks about wages from only one-fourth of the overall sample of employed workers, the number of job switchers who also reported wages can be small for any given month. For that reason, a series of 12-month files were constructed to estimate how the earnings of job switchers and job stayers have evolved over time. The first of these files contains data on the wages of workers from January 2020 to December 2020, matched to their wages from January 2019 to December 2019. The last of these files contains data on the wages of workers from April 2021 to March 2022, matched to their wages from April 2020 to March 2021. Changes in earnings from one year to the next are estimated for individual workers and the median of these individual changes is presented in the report, as well as the shares of workers seeing a gain in earnings.
Race, ethnicity, and educational attainment
White, Black and Asian adults include those who report being only one race and who are not Hispanic. Hispanics are of any race. Other racial and ethnic groups are included in all totals but are not shown separately.
“High school graduate” refers to those who have a high school diploma or its equivalent, such as a General Education Development (GED) certificate, and those who had completed 12th grade, but their diploma status was unclear (those who had finished 12th grade but not received a diploma are excluded). Adults with “some college” include those with an associate degree and those who attended college but did not obtain a degree.
Statistical significance
Comparisons between estimates are tested for statistical significance using the ‘pweight’ option in Stata and the 99% confidence interval, unless otherwise mentioned. Replicate weights are not included in the monthly CPS files.
The American Trends Panel survey methodology
Overview
The American Trends Panel (ATP), created by Pew Research Center, is a nationally representative panel of randomly selected U.S. adults. Panelists participate via self-administered web surveys. Panelists who do not have internet access at home are provided with a tablet and wireless internet connection. Interviews are conducted in both English and Spanish. The panel is being managed by Ipsos.
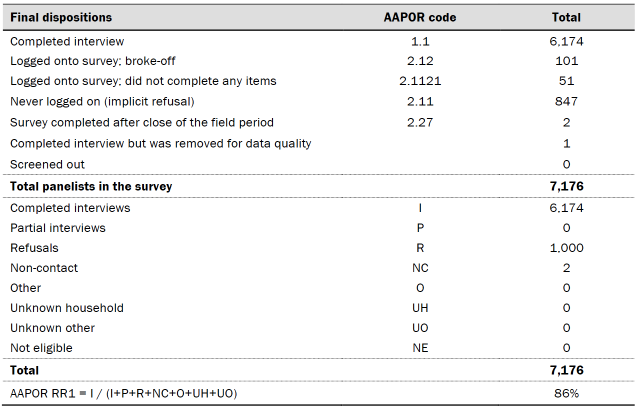
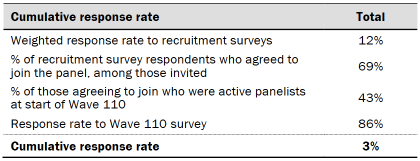
Data in this report is drawn from the panel wave conducted from June 27 to July 4, 2022, and included oversamples of Asian, Black and Hispanic adults, as well as 18- to 29-year-old Republicans and Republican-leaning independents in order to provide more precise estimates of the opinions and experiences of these smaller demographic subgroups. These oversampled groups are weighted back to reflect their correct proportions in the population. A total of 6,174 panelists responded out of 7,176 who were sampled, for a response rate of 86%. The cumulative response rate accounting for nonresponse to the recruitment surveys and attrition is 3%. The break-off rate among panelists who logged on to the survey and completed at least one item is 2%. The margin of sampling error for the full sample of 6,174 respondents is plus or minus 1.8 percentage points.
Panel recruitment
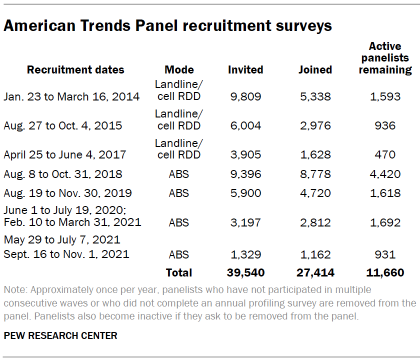
The ATP was created in 2014, with the first cohort of panelists invited to join the panel at the end of a large, national, landline and cellphone random-digit-dial survey that was conducted in both English and Spanish. Two additional recruitments were conducted using the same method in 2015 and 2017, respectively. Across these three surveys, a total of 19,718 adults were invited to join the ATP, of whom 9,942 (50%) agreed to participate.
In August 2018, the ATP switched from telephone to address-based recruitment. Invitations were sent to a stratified, random sample of households selected from the U.S. Postal Service’s Delivery Sequence File. Sampled households receive mailings asking a randomly selected adult to complete a survey online. A question at the end of the survey asks if the respondent is willing to join the ATP. Starting in 2020 another stage was added to the recruitment. Households that do not respond to the online survey are sent a paper version of the questionnaire, $5 and a postage-paid return envelope. A subset of the adults returning the paper version of the survey are invited to join the ATP. This subset of adults receive a follow-up mailing with a $10 pre-incentive and invitation to join the ATP.
Across the four address-based recruitments, a total of 19,822 adults were invited to join the ATP, of whom 17,472 agreed to join the panel and completed an initial profile survey. In each household, the adult with the next birthday was asked to go online to complete a survey, at the end of which they were invited to join the panel. Of the 27,414 individuals who have ever joined the ATP, 11,660 remained active panelists and continued to receive survey invitations at the time this survey was conducted.
The U.S. Postal Service’s Delivery Sequence File has been estimated to cover as much as 98% of the population, although some studies suggest that the coverage could be in the low 90% range.4 The American Trends Panel never uses breakout routers or chains that direct respondents to additional surveys.
Sample design
The overall target population for this survey was non-institutionalized persons ages 18 and older living in the U.S., including Alaska and Hawaii. It featured a stratified random sample from the ATP in which Asian, Black and Hispanic adults, as well as 18- to 29-year-old Republicans and Republican-leaning independents were selected with certainty. The remaining panelists were sampled at rates designed to ensure that the share of respondents in each stratum is proportional to its share of the U.S. adult population to the greatest extent possible. Respondent weights are adjusted to account for differential probabilities of selection as described in the Weighting section below.
Questionnaire development and testing
The questionnaire was developed by Pew Research Center in consultation with Ipsos. The web program was rigorously tested on both PC and mobile devices by the Ipsos project management team and Pew Research Center researchers. The Ipsos project management team also populated test data that was analyzed in SPSS to ensure the logic and randomizations were working as intended before launching the survey.
Incentives
All respondents were offered a post-paid incentive for their participation. Respondents could choose to receive the post-paid incentive in the form of a check or a gift code to Amazon.com or could choose to decline the incentive. Incentive amounts ranged from $5 to $20 depending on whether the respondent belongs to a part of the population that is harder or easier to reach. Differential incentive amounts were designed to increase panel survey participation among groups that traditionally have low survey response propensities.
Data collection protocol
The data collection field period for this survey was June 27 to July 4, 2022. Postcard notifications were mailed to all ATP panelists with a known residential address on June 27, 2022.
Invitations were sent out in two separate launches: Soft Launch and Full Launch. Sixty panelists were included in the soft launch, which began with an initial invitation sent on June 27, 2022. The ATP panelists chosen for the initial soft launch were known responders who had completed previous ATP surveys within one day of receiving their invitation. All remaining English- and Spanish-speaking panelists were included in the full launch and were sent an invitation on June 28, 2022.
All panelists with an email address received an email invitation and up to two email reminders if they did not respond to the survey. All ATP panelists that consented to SMS messages received an SMS invitation and up to two SMS reminders.

Data quality checks
To ensure high-quality data, the Center’s researchers performed data quality checks to identify any respondents showing clear patterns of satisficing. This includes checking for very high rates of leaving questions blank, as well as always selecting the first or last answer presented. As a result of this checking, one ATP respondent was removed from the survey dataset prior to weighting and analysis.
Weighting
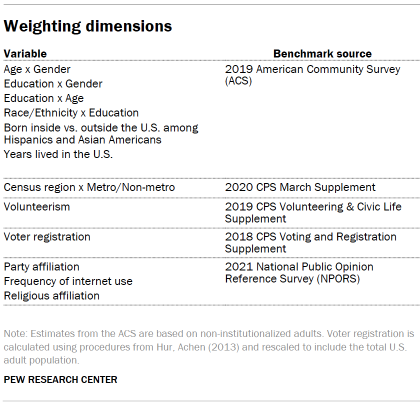
The ATP data is weighted in a multistep process that accounts for multiple stages of sampling and nonresponse that occur at different points in the survey process. First, each panelist begins with a base weight that reflects their probability of selection for their initial recruitment survey. The base weights for panelists recruited in different years are scaled to be proportionate to the effective sample size for all active panelists in their cohort and then calibrated to align with the population benchmarks in the accompanying table to correct for nonresponse to recruitment surveys and panel attrition. If only a subsample of panelists was invited to participate in the wave, this weight is adjusted to account for any differential probabilities of selection.
Among the panelists who completed the survey, this weight is then calibrated again to align with the population benchmarks identified in the accompanying table and trimmed at the 1st and 99th percentiles to reduce the loss in precision stemming from variance in the weights. Sampling errors and tests of statistical significance take into account the effect of weighting.
Some of the population benchmarks used for weighting come from surveys conducted prior to the coronavirus outbreak that began in February 2020. However, the weighting variables for panelists recruited in 2021 were measured at the time they were recruited to the panel. Likewise, the profile variables for existing panelists were updated from panel surveys conducted in July or August 2021.
This does not pose a problem for most of the variables used in the weighting, which are quite stable at both the population and individual levels. However, volunteerism may have changed over the intervening period in ways that made their 2021 measurements incompatible with the available (pre-pandemic) benchmarks. To address this, volunteerism is weighted using the profile variables that were measured in 2020. For all other weighting dimensions, the more recent panelist measurements from 2021 are used.
For panelists recruited in 2021, plausible values were imputed using the 2020 volunteerism values from existing panelists with similar characteristics. This ensures that any patterns of change that were observed in the existing panelists were also reflected in the new recruits when the weighting was performed.
The following table shows the unweighted sample sizes and the error attributable to sampling that would be expected at the 95% level of confidence for different groups in the survey.
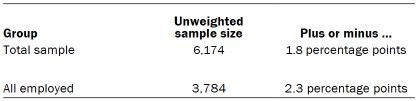
Sample sizes and sampling errors for other subgroups are available upon request. In addition to sampling error, one should bear in mind that question wording and practical difficulties in conducting surveys can introduce error or bias into the findings of opinion polls.
Dispositions and response rates
Adjusting income and defining income tiers
To create upper-, middle- and lower-income tiers, respondents’ 2020 family incomes were adjusted for differences in purchasing power by geographic region and household size. “Middle-income” adults live in families with annual incomes that are two-thirds to double the median family income in the panel (after incomes have been adjusted for the local cost of living and household size). The middle-income range for the American Trends Panel is about $42,000 to $125,900 annually for an average family of three. Lower-income families have incomes less than roughly $42,000, and upper-income families have incomes greater than roughly $125,900 (all figures expressed in 2020 dollars).
Based on these adjustments, 32% of respondents are lower income, 47% are middle income and 16% fall into the upper-income tier. An additional 5% either didn’t offer a response to the income question or the household size question.
For more information about how the income tiers were determined, please see here.
A note about the Asian sample
This survey includes a total sample size of 357 Asian Americans. The sample includes English-speaking Asian Americans only and, therefore, may not be representative of the overall Asian American population (73% of our weighted Asian American sample was born in another country, compared with 77% of the Asian American adult population overall). Despite this limitation, it is important to report the views of Asian Americans on the topics in this study. As always, Asian Americans’ responses are incorporated into the general population figures throughout this report.
© Pew Research Center, 2022