The analysis presented in this report and the accompanying fact sheet about the Black population of the United States combines the latest data available from multiple data sources. It is mainly based on data from the U.S. Census Bureau’s 2006-2019 American Community Surveys (ACS) and the following U.S. decennial censuses provided through the Integrated Public Use Microdata Series (IPUMS) from the University of Minnesota: 1900, 1910, 1920, 1930, 1940, 1950, 1960, 1970 (form 2), 1980, 1990 and 2000. The ACS is used to present demographic and economic characteristics for each group.
This data was collected before the COVID-19 pandemic.
This report relies on self-identification of race and ethnicity in U.S. Census Bureau products (decennial censuses and iterations of the American Community Survey) to identify the nation’s Black population. However, an individual’s racial and ethnic self-identification may not be fixed and instead can change over time. In addition, the racial and ethnic categories used by the U.S. Census Bureau can change as the way the nation sees itself changes (see the “Measuring ethnic and racial identity” section of this report for more details on census years). These changes may impact how many people identify as Black (or any other race).
Unless otherwise noted, adults are those who are ages 18 and older.
U.S. Black population or total Black population refers to all people who self-identify as Black in the United States. This includes those who say their race is only Black; those who say Black is one of two or more races in their background; and those who say they their race is Black, or that one of their races is Black but also indicate they are of Hispanic or Latino or Black origin. The terms Black population and Black people are used interchangeably in this report.
The terms single-race Black and Black alone are used interchangeably throughout the report to refer to the same population. This population is made up of individuals who self-identify only as Black and do not identify as Hispanic or Latino.
The term multiracial Black is used to refer to people who self-identify as two or more races and do not identify as Hispanic or Latino.
The term Black Hispanic is used to refer to those who self-identify as Black and Hispanic or Latino, as well as those who self-identify as multiracial Black and Hispanic or Latino.
The terms Hispanic or Latino are used interchangeably throughout this report.
White refers to people who self-identify as White only (single race) and do not identify as Hispanic or Latino.
Asian refers to people who self-identify as Asian only (single race) and do not identify as Hispanic or Latino.
U.S. born refers to people who are U.S. citizens at birth, including those born in the United States, Puerto Rico, U.S. territories and those born in other countries to parents at least one of whom was a U.S. citizen.
Foreign born refers to people born outside of the United States to parents neither of whom was a U.S. citizen. The terms foreign born and immigrant are used interchangeably in this report.
In this report, we refer to several generations. These are defined by their birth years and ages in 2019 as follows:
| Generation | Birth years | Age in 2019 |
|---|---|---|
| Under 7 | 2012-present | 0-6 |
| Generation Z (Gen Z)* | 1997-2012 | 7-22 |
| Millennial | 1981-1996 | 23-38 |
| Generation X (Gen X) | 1965-1980 | 39-54 |
| Baby Boomer (Boomer) | 1946-1964 | 55-73 |
| Silent | 1928-1945 | 74-91 |
| Greatest | Before 1928 | 92 and older |
The Black population of the United States is diverse. Its members have varied histories in the nation – many are descendants of enslaved people, while others are recently arrived immigrants. The Black population also has nuanced ethnic and racial identities reflecting intermarriage and international migration. As a result, there are key distinctions in demographic and economic characteristics between different parts of the national Black population, highlighting its diverse multitude of backgrounds.
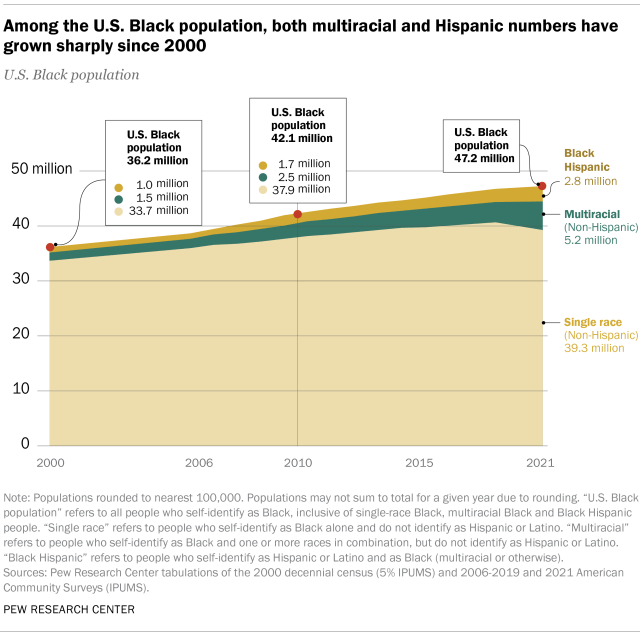
The U.S. Black population is also growing. In 2019, 46.8 million people in the U.S. identified their race as Black, either alone or as part of a multiracial or ethnic background. That is up from 36.2 million in 2000.1 The Black share of the U.S. population is higher today than in 2000 as well. About 14% of the national population said they were Black in 2019, up from 13% who did so in 2000.
At the same time, the Black population’s racial self-identification is changing. Among those who self-identify as “Black or African American,” the share who say it is their only racial or ethnic identification has declined over the past two decades. In 2019, 40.7 million, or 87%, identified their race as Black alone and their ethnicity as non-Hispanic, while around 3.7 million, or 8%, indicated their race was Black and another race (most often White) and not Hispanic. Another 2.4 million, or 5%, self-identified as both Black and Hispanic, or Black Hispanic.2But these shares have changed since 2000. Then, 93% identified their race and ethnicity as Black alone.
The nation’s Black population is changing in other ways too. A growing share are foreign born, the population is aging (though some segments are significantly younger), and a growing share are college graduates. These trends and more are explored in this report. Accompanying it is a fact sheet showing the demographic and economic characteristics of the nation’s Black population in 2019, based on the U.S. Census Bureau’s 2019 American Community Survey. Findings for all Black people, non-Hispanic single-race Black people, non-Hispanic multiracial Black people and Black Hispanics are shown separately. A downloadable spreadsheet of findings is also available.
Measuring racial and ethnic identity
Racial identity – as measured by the U.S. decennial census – has changed over time. The census has drastically changed since its first administration in 1790. Then, only two racial categories were included: free (which mostly included White people) and slaves (who were mostly enslaved Black people). The Census Bureau has modified terms used to refer to people of non-White racial identities throughout the years, in accordance with the politics and sensibilities of the times. For example, in the 2020 census, those who selected “Black or African American” as their race were asked to write more about their origins, reflecting a more nuanced understanding of Black racial identity. (For more about how racial and ethnic categories have changed over time, see “What Census Calls Us.”)
Today, decennial census and American Community Survey data is collected in a different manner than for most of the nation’s history. Respondents choose their racial response categories themselves. This was not true for over a century of censuses. Prior to 1960, one’s racial identification was selected by a census-taker – a Census Bureau employee who administered the survey on paper and chose a racial category on a person’s behalf. However, starting that year, some respondents could self-identify, or chose their own racial category. Self-identification was expanded in subsequent censuses to include virtually all respondents. Additionally, starting in 1980, census data included information from the entire population on Hispanic or Latino ethnic identity in addition to their racial identification.And the 2000 census marked the first time respondents were able to include themselves in more than one racial category; prior to that year, multiracial respondents could select only one racial category.
It’s important to note that racial and ethnic self-identification is highly personal and can change as one’s relationship with their identity changes. For example, an analysis of 168 million Americans’ census forms linked between 2000 and 2010 indicated that 10 million people identified their racial and/or ethnic background differently between the two census forms. Multiracial Americans were one of the population groups that were more likely to change their racial identification between the two decennial census years.
One-in-four Black people are members of Gen Z
The age structure of the Black population has also changed since 2000. As of 2019, the median age of single-race, non-Hispanic Black people is 35, compared with 30 in 2000. This makes the nation’s Black population younger than the nation’s single-race, non-Hispanic White population (with a median age of 43) and the single-race, non-Hispanic Asian population (38), and slightly older than the nation’s Hispanic population (29).
The median age for the entire Black population is 32, though it varies across the differing identities among the Black population. Among Black Hispanic people, it is 22 years. Meanwhile, multiracial Black people are the youngest group, with a median age of 16.
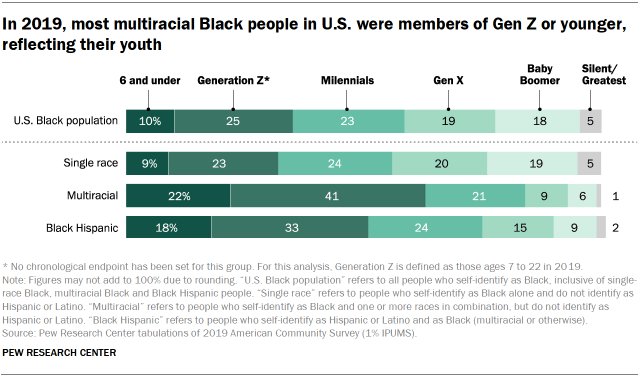
A quarter (25%) of those in the U.S. Black population are members of Generation Z – born between 1997 and 2012 and ages 7 to 22 in 2019. A further one-in-ten were under the age of 7 that year. Together, 35% of the U.S. Black population is age 22 or younger. Another 23% are Millennials, meaning that over half (59%) of the nation’s Black population were Millennials or younger (under age 38) in 2019.
The majority (63%) of multiracial Black people were age 22 or younger in 2019, reflecting the youth of this demographic subgroup. Roughly half (51%) of Black Hispanics were 22 or younger as well.
Over half of the Black population lives in the South
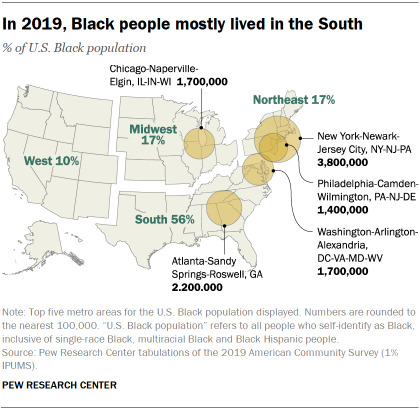
In 2019, the South was the region with the highest share of the country’s Black population, with 56% of this population living there. The Midwest and Northeast each held 17% of this population, while the West was home to one-tenth of the Black population.
Regionally, the share of the national Black population living in the South has grown. In 2000, over half (54%) of Black people in the U.S. lived in the South, a very similar share to 2019 (56%). Meanwhile, somewhat higher shares lived the Midwest and Northeast in 2000 than in 2019. Back then, 19% of the national Black population lived in the Midwest and 18% in the Northeast. Over the past two decades, the share of Black people living in Western states was unchanged, at 10%.
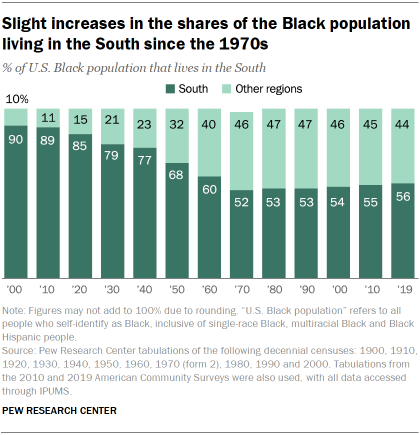
The growth of the Black population in the South suggests a departure from previous Black migration patterns. The first half of the 20th century featured increasing shares of the population residing in regions of the U.S. outside of the South, primarily after the start of the Great Migration in the late 1910s. Consequently, each decade featured decreasing shares of the Black population living in the South.
Starting in 1970, shares of the Black population who live in the South have grown. There has been a 4 percentage point increase in the shares of the Black population who live in the South between 1970 (52%) and 2019 (56%).
Texas has the largest Black state population
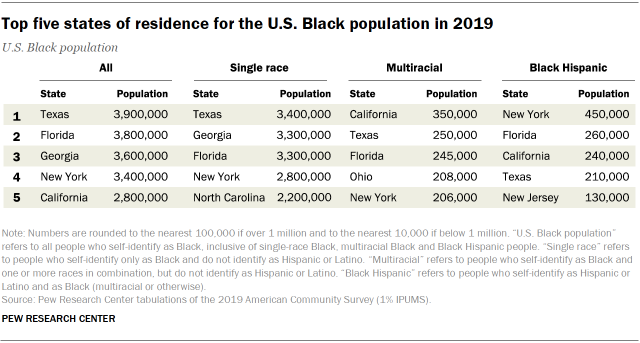
With more than 3.9 million Black people in 2019, Texas is home to the largest Black population in the U.S. Florida has the second largest population at 3.8 million, and Georgia is home to 3.6 million Black people. Other top states of residence include New York (3.4 million) and California (2.8 million). Together, these five states hold 37% of the national Black population.
Although the top five states of residence have remained the same for Black people as in 2000, the order shifted substantially, with New York and California dropping from the two largest to fourth and fifth in 2019. In 2000, New York (3.2 million), California, Texas, Florida (each 2.5 million) and Georgia (2.4 million) rounded out the top five, together holding 36% of the total Black population.
Top states of residence differ by racial subgroup. Among non-Hispanic single-race Black people, Texas has the largest population, followed by Georgia, Florida, New York and North Carolina. But among non-Hispanic multiracial Black people, the state with the largest population is California, followed by Texas, Florida, Ohio and New York. Among Black Hispanics, meanwhile, New York has the largest population, followed by Florida, California, Texas and New Jersey. Notably, Texas, New York and Florida make the top five for all subgroups.
The New York metropolitan area has the largest Black metropolitan population
The metropolitan area with greatest number of Black people is the New York metropolitan area, with roughly 3.8 million in 2019. The New York City area has been the top urban center since at least 2000 for Black people, though other metro areas are on the rise. In 2019, the Atlanta metropolitan area came in a distant second, with 2.2 million Black people, and the Washington, D.C., area was next, with 1.7 million. By comparison, in 2000, the Chicago metropolitan area had the second largest Black metro population and Atlanta had the fourth largest.
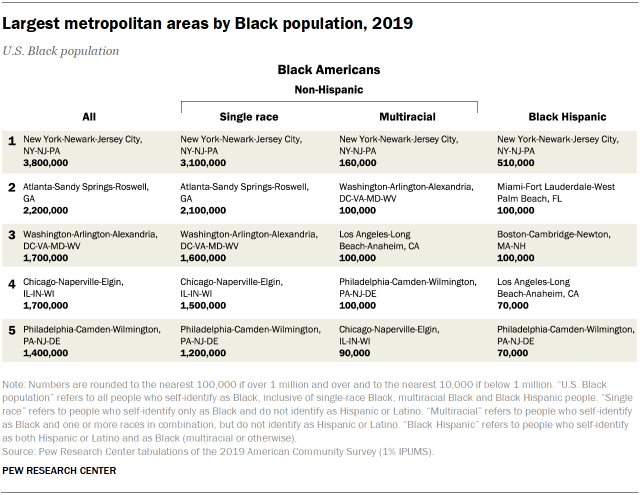
The New York City metropolitan area has the largest Black population across the three Black racial and ethnic subgroups, but the other top large metropolitan areas differ across categories. The list of top five metropolitan areas for those who say their racial identity is only Black is the same as it is for the Black population overall, reflecting their majority (87%) share of the population. However, the top metropolitan areas for multiracial Black people and Black Hispanics differ.
Besides New York City, the top urban centers for those identifying as multiracial Black are the Washington, D.C., Los Angeles, Philadelphia and Chicago metropolitan areas. By contrast, for Black Hispanics, Miami is second, followed by the Boston, Los Angeles and Philadelphia metro areas.
A growing share of Black adults have a college degree
The number of Black adults with a college degree or more education has more than doubled since 2000. That year, roughly 3 million Black adults ages 25 and older, or 15%, had earned at least a bachelor’s degree. That number grew to 6.7 million (23%) in 2019.
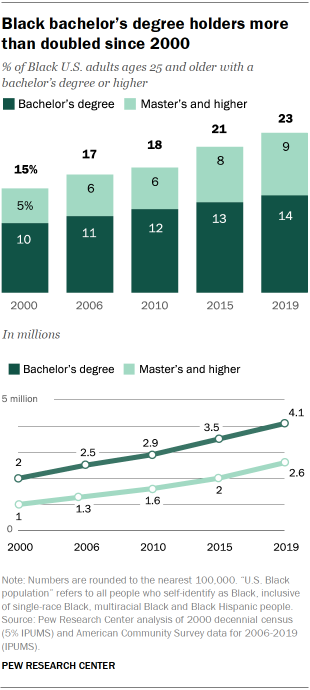
Notably, the share of the Black population with at least a college degree has risen at a similar rate to that of the general population. In 2000, roughly a quarter (24%) of the entire U.S. population ages 25 and older had a bachelor’s degree or higher. In 2019, that share rose to 33%, an increase of 9 percentage points. The share of Black adults who earned a bachelor’s degree or higher also grew nearly 9 points over the same time period, from 15% to 23%.
There has been a similar upward trend specifically among Black adults with a master’s degree or higher. While roughly 1 million Black adults in 2000 (5% of the population over 25) had an advanced degree, that number rose to almost 2.6 million, or 9% in 2019.
There were differences in educational attainment in 2019 among different subgroups of the Black population. Among these groups, the multiracial Black population has the highest shares of adults 25 and older with a bachelor’s degree (20%) and advanced degree (12%). Single-race Black adults and Black Hispanics 25 and older have similar, but lower, shares with a bachelor’s degree (14% and 15%, respectively) as well as an advanced degree (9% and 8%).
The share of Black adults 25 and older without a high school diploma (or its equivalent, such as a GED certificate) has dropped substantially – by more than half – since 2000. Then, roughly three-in-ten adults in that age range (28%) had not earned a high school diploma. In 2019, that share had dropped to 13%, signifying a 15 percentage point drop over almost two decades.
The Black immigrant population has grown in number and share

Immigrants are a part of the nation’s Black population that has grown over time. The foreign-born Black population has nearly doubled since 2000, rising from 7% then to 10% in 2019. In numbers, 2.4 million Black people were born in another country in 2000, and by 2019, that had risen to 4.6 million.
Black immigrants are mostly from just two regions of the world. Almost nine-in-ten (88%) were born in African or Caribbean countries. Of that group, a little less than half (46%) were born in Caribbean nations, while a slightly lower share (42%) are from African countries. The remaining 12% of Black immigrants are from other parts of the world, with Guyana, Mexico and Honduras as the top three countries of origin.
The majority of Black immigrants identify as single-race Black (87%) and non-Hispanic, while 10% identify as Black and Hispanic and 3% say their racial background is multiracial.
Black household incomes since 2000
Since 2000, the U.S. Black population has not seen significant increases in median household income. The median income for households headed by a Black person was $44,000 in 2019 (before the COVID-19 pandemic-induced recession). But household income of Black households varies. Roughly three-in-ten Black households (29%) made less than $25,000 in 2019, while a quarter earned between $25,000 and $49,999 – which means that more than half (54%) of Black households made less than $50,000 in 2019. About one-in-six Black households (17%) made $50,000 but below $75,000, 10% earned at least $75,000 but less than $100,000, and 18% earned $100,000 or more in 2019.
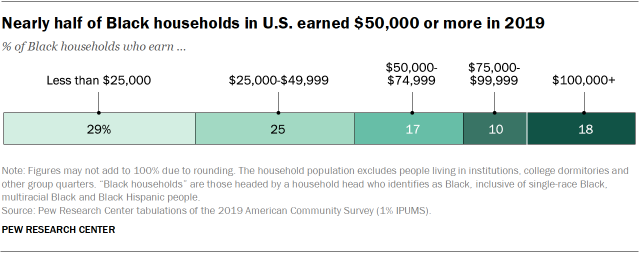
The 2019 shares represent an improvement over the distribution of Black household income in 2000. In 2000, roughly three-in-ten (31%) Black-headed households made $25,000 or less (in 2019 U.S. dollar adjusted value), and a quarter (25%) made between $25,000 and $49,999, meaning that 56% of Black households earned less than $50,000 in 2000. In that same year, roughly three-in-ten Black households (28%) made at least $50,000 but less than $100,000, and 16% made $100,000 or more.
The median income among Black households in 2019 was roughly $44,000, representing a slight inflation-adjusted increase over the median household income for Black people in 2000 ($43,581 after adjusting for inflation).
Income inequality within the Black population remains one of the widest within a major racial or ethnic group. In 2019, Black-headed households with income in the 90th percentile among the population of Black households earned 14 times that of Black households with income in the 10th percentile. The 90th percentile of households in the overall 2019 population, by contrast, earned 12 times that of households with incomes in the 10th percentile.
CORRECTION (March 2, 2023): A previous version of the chart “Among the U.S. Black population, both multiracial and Hispanic numbers have grown since 2000” displayed incorrect estimates for the total Black and multiracial Black populations in the U.S. for 2010. None of the study findings or conclusions are affected.
CORRECTION (Aug. 4, 2021): The “Black household incomes” section has been updated to reflect the 2019 inflation-adjusted distribution of Black household incomes in 2000, which was mischaracterized in a previous version. Related changes have been made to any references in the text of the report. These changes do not substantively affect the report’s findings.


