*Visit the most recent data.
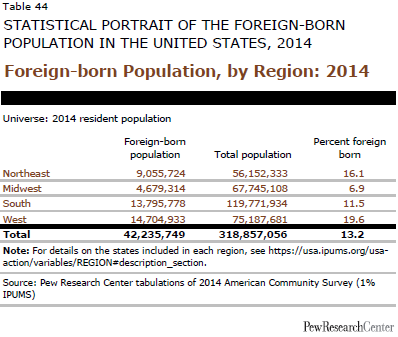
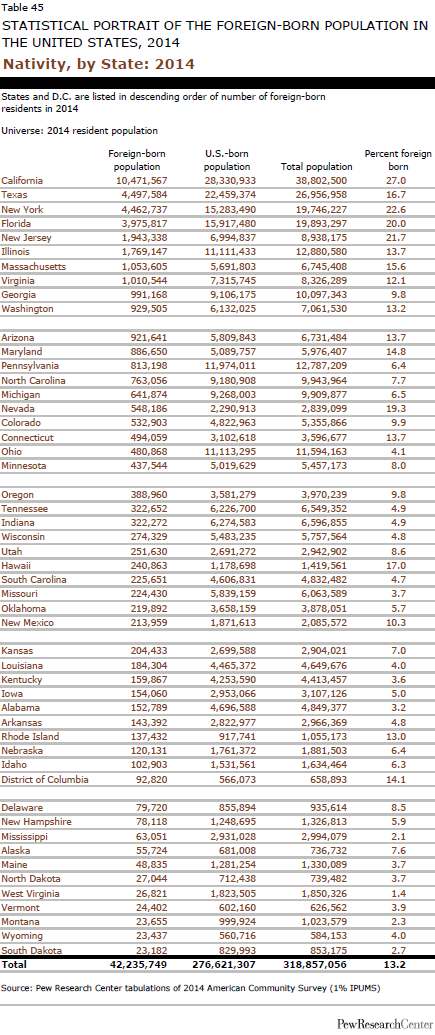
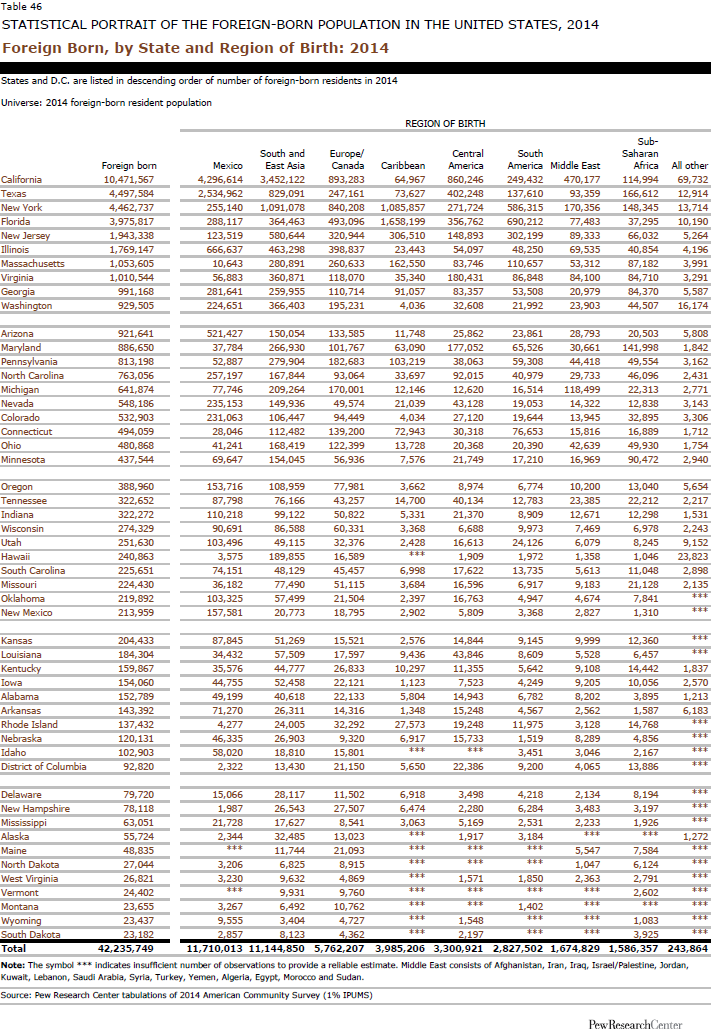
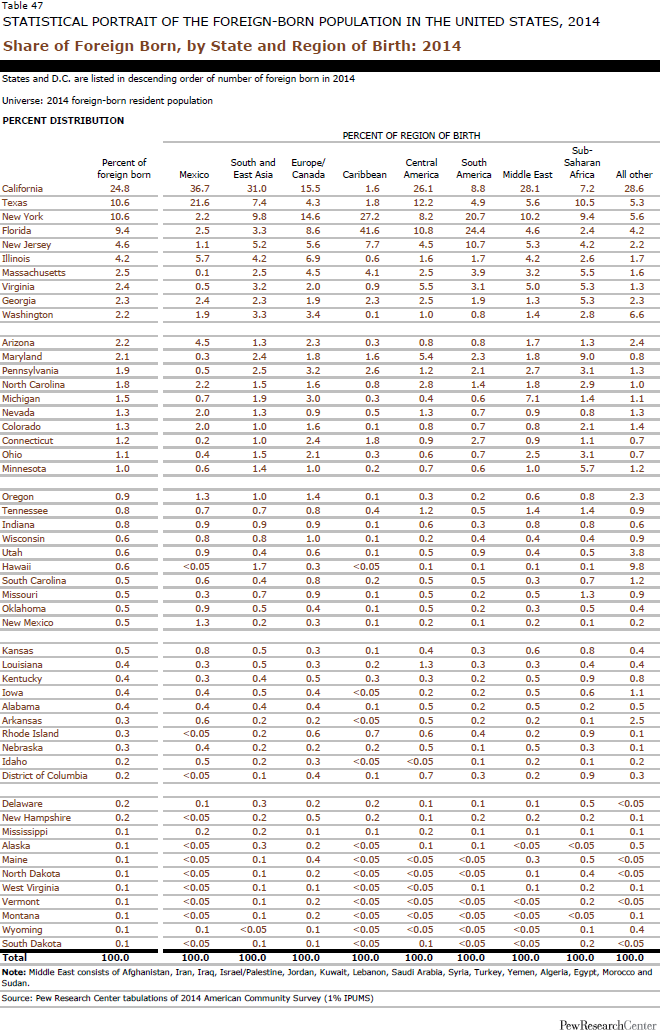
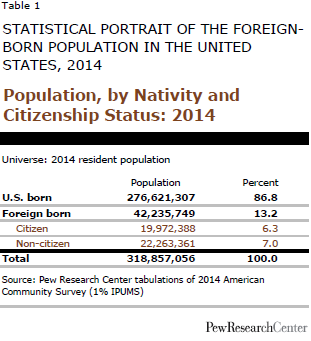
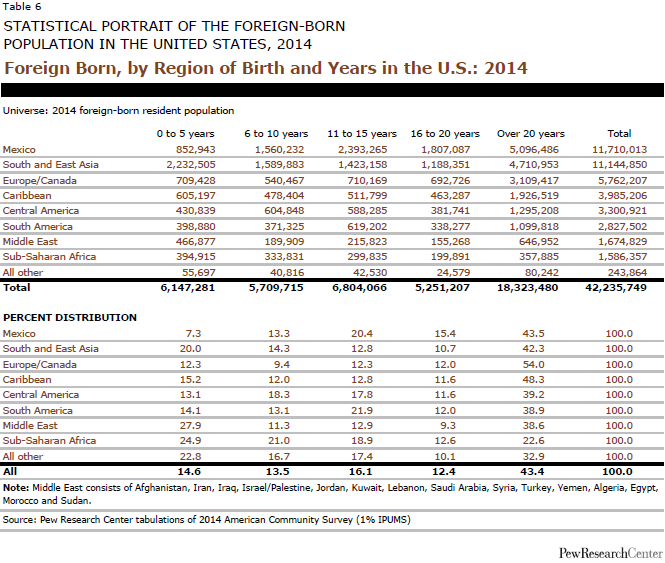
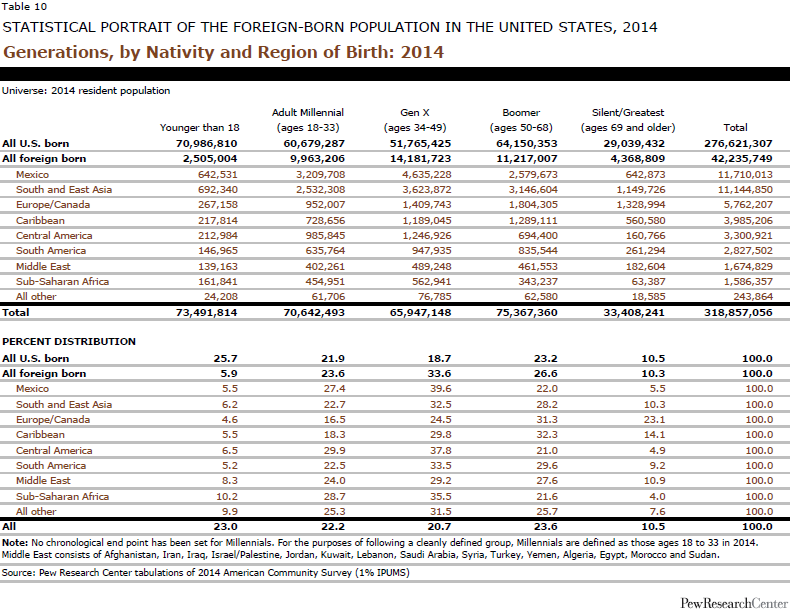
There were a record 42.2 million immigrants living in the U.S. in 2014, making up 13.2% of the nation’s population. This represents a fourfold increase since 1960, when only 9.7 million immigrants lived in the U.S., accounting for just 5.4% of the total U.S. population. Click on any of the bold headings below in the summary table to see detailed tables for each.
Click here for a PDF of all the tables below and read the accompanying report. Download the Excel workbook.
For a statistical portrait of the Hispanic population in the United States, click here.
| Characteristics of the U.S. Foreign-born Population: 2014 | |
|---|---|
| % of the foreign-born population, unless otherwise noted | |
| Population/Region of Birth/Nativity/Language Use/Race/Years in the U.S. | |
| Population (#) | 42,235,749 |
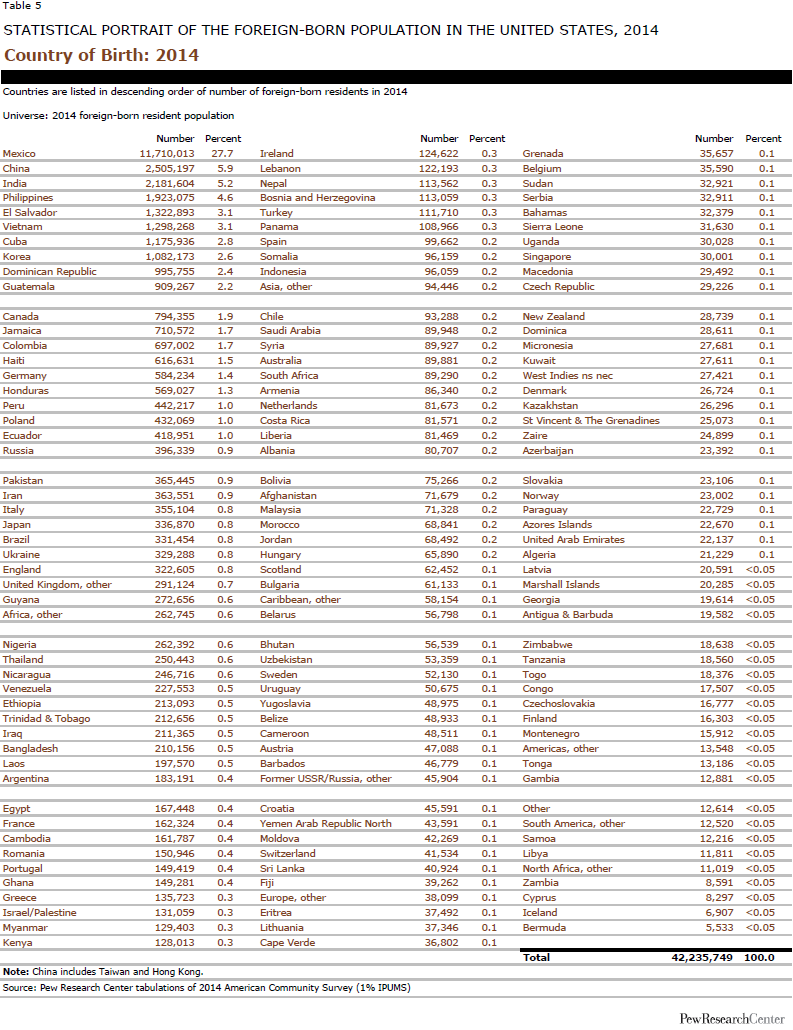
| Born in Mexico | 27.7 |
| Citizen | 47.3 |
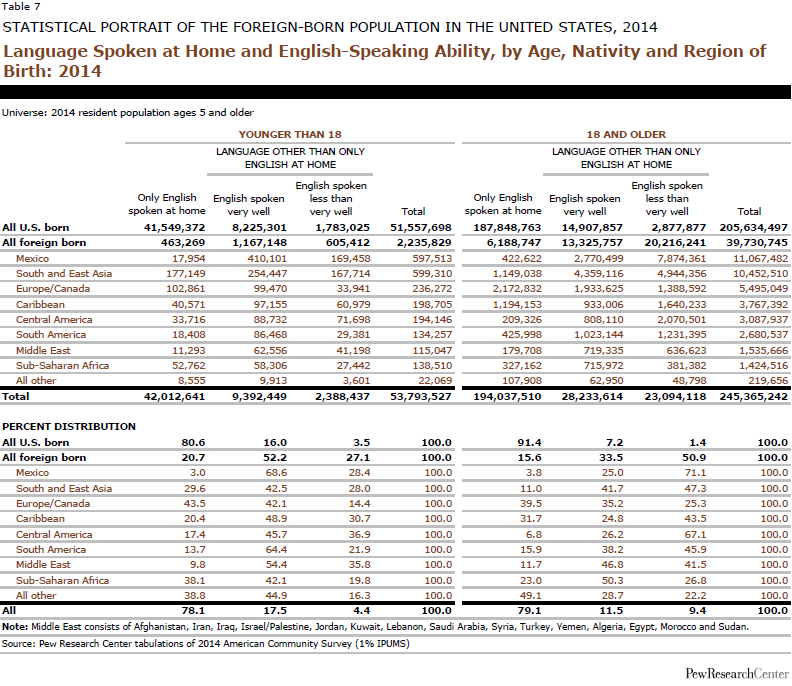
| Speaking English at least very well (ages 5 and older) | 50.4 |
| White alone, not Hispanic | 18.1 |
| Age/Gender/Marital Status/Fertility | |
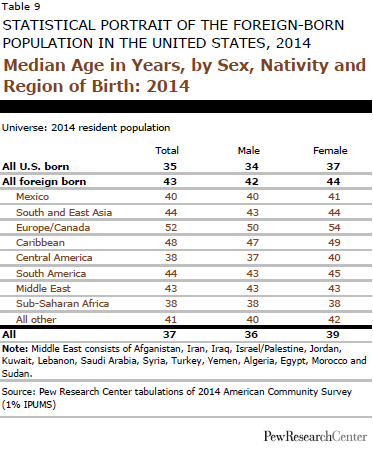
| Median age (in years) | 43 |
| Female | 51.3 |
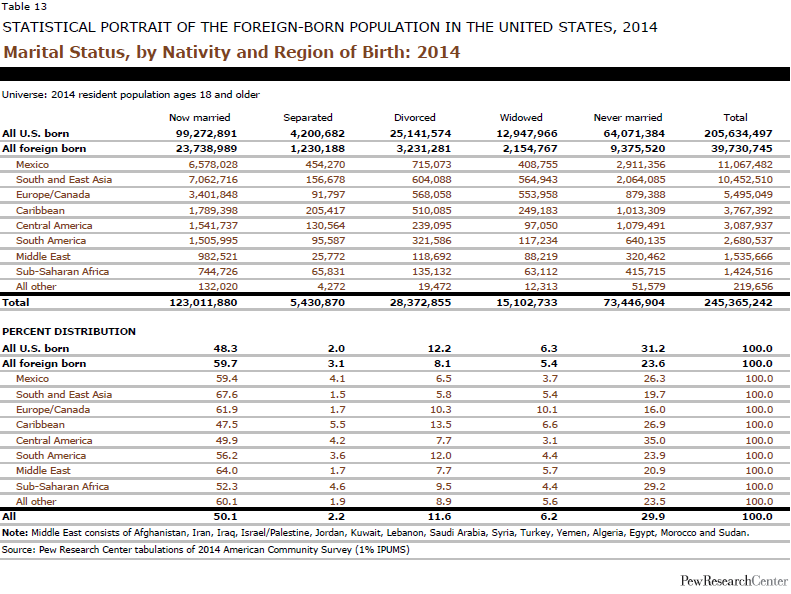
| Married (ages 18 and older) | 59.7 |
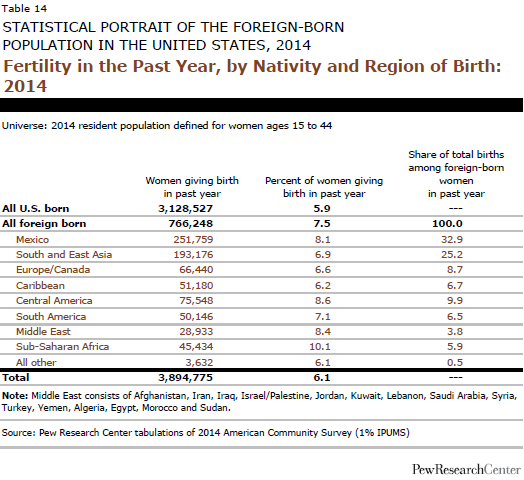
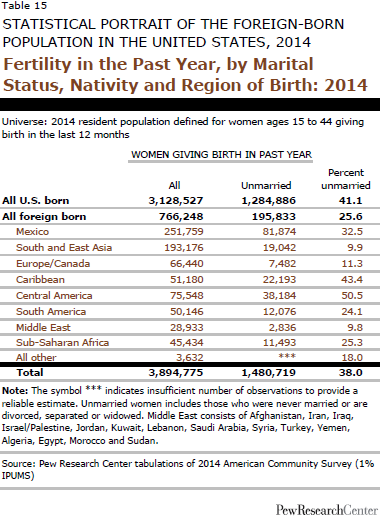
| Women ages 15-44 giving birth in past year | 7.5 |
| Educational Attainment and Enrollment (highest degree completed, ages 25 and older) | |
| High school graduate or less | 52.4 |
| Two-year degree/Some college | 19.0 |
| Bachelor’s degree or more | 28.6 |
| Work/Earnings/Income (ages 16 and older) | |
| In labor force (among civilian population) | 66.3 |
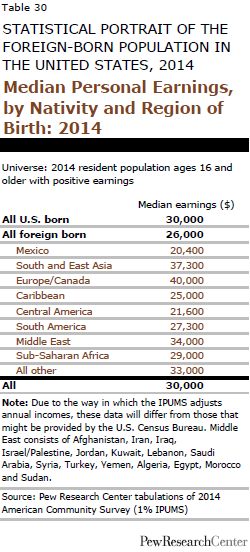
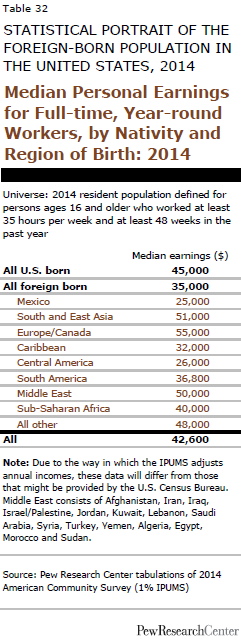
| Median annual personal earnings (in 2014 dollars, among those with earnings) | $26,000 |
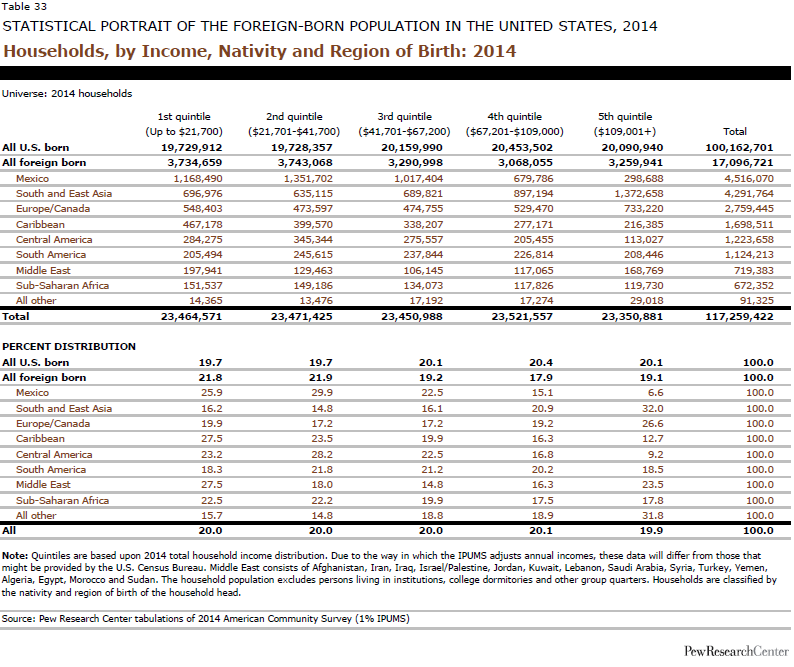
| Median annual household income (in 2014 dollars) | $49,071 |
| Poverty/Health Care | |
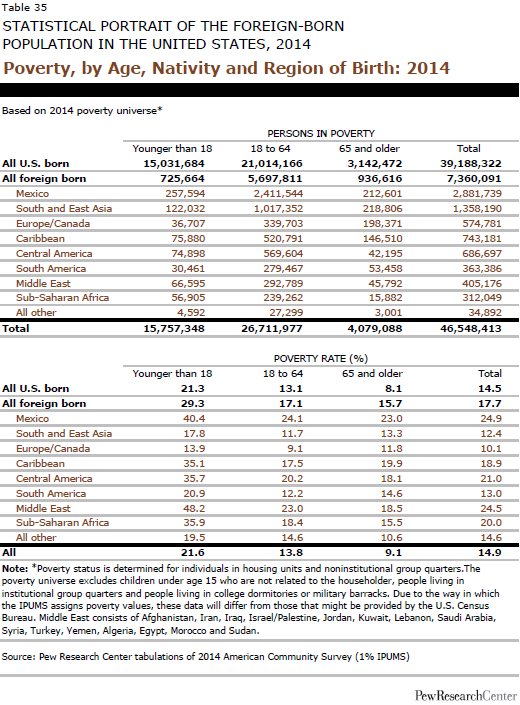
| Living in poverty | 17.7 |
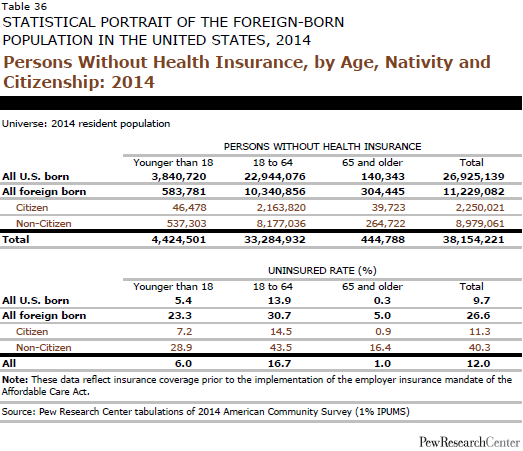
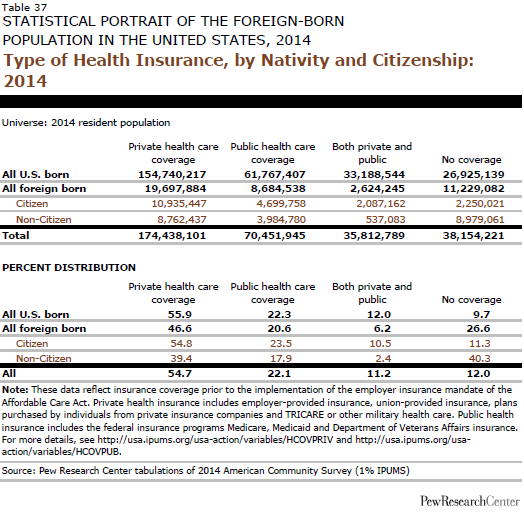
| Uninsured | 26.6 |
| Homeownership and Household Characteristics | |
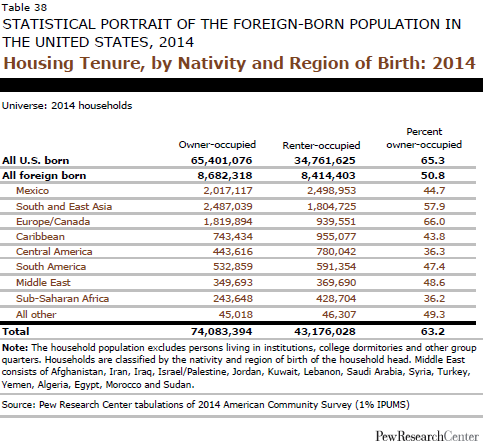
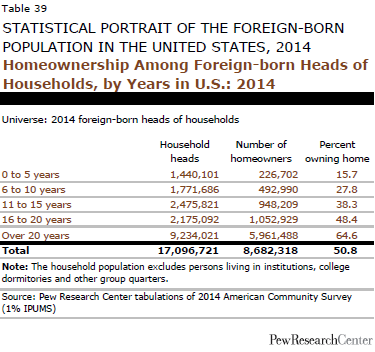
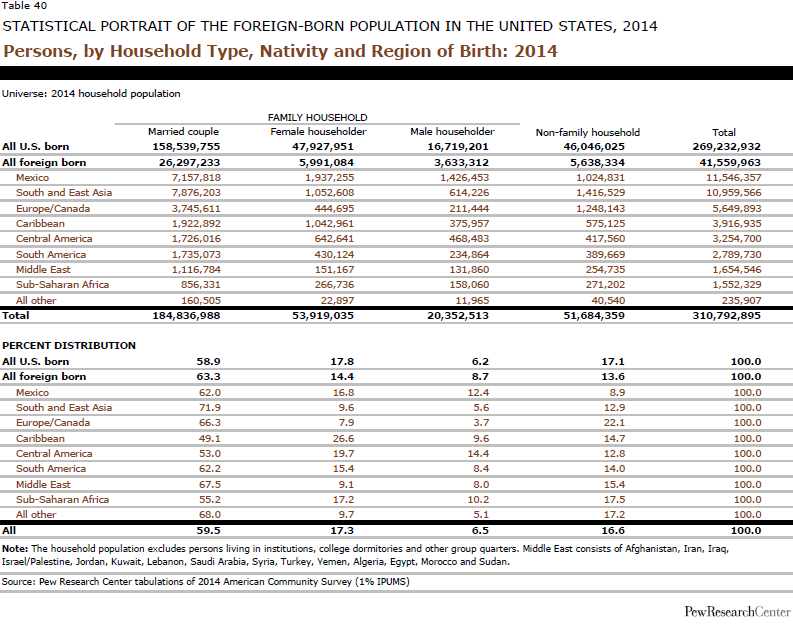
| In family households | 86.4 |
| Region and Top Five States of Residence in 2014 | |
| West | 34.8 |
| California | 24.8 |
| South | 32.7 |
| Texas | 10.6 |
| Florida | 9.4 |
| Northeast | 21.4 |
| New York | 10.6 |
| New Jersey | 4.6 |
| Midwest | 11.1 |
| Source: Pew Research Center tabulations of 2014 American Community Survey (1% IPUMS) |
Click on each heading below to expand and see detailed tables.
How we did this

How we did this
How we did this

How we did this


How we did this
How we did this
How we did this