Immigrants have contributed significantly to the growth and diversity of the Black population in the United States. Between 2000 and 2024, the number of Black immigrants in the country steadily increased. Immigrants now make up about one-in-ten Black people in the U.S.
In 2025, the U.S. immigrant population declined for the first time in 50 years. It’s unclear how much recent federal actions on immigration – such as ending or proposing to end temporary deportation protections for immigrants from several countries and pausing the issuance of diversity visas – may affect the size of the Black immigrant population specifically.
Pew Research Center regularly publishes research on Black Americans and U.S. immigrants. Here are some key findings about Black immigrants in the U.S., based on the most recent detailed data available – in most cases, the U.S. Census Bureau’s 2024 American Community Survey.
Related: Key facts about the U.S. Black population
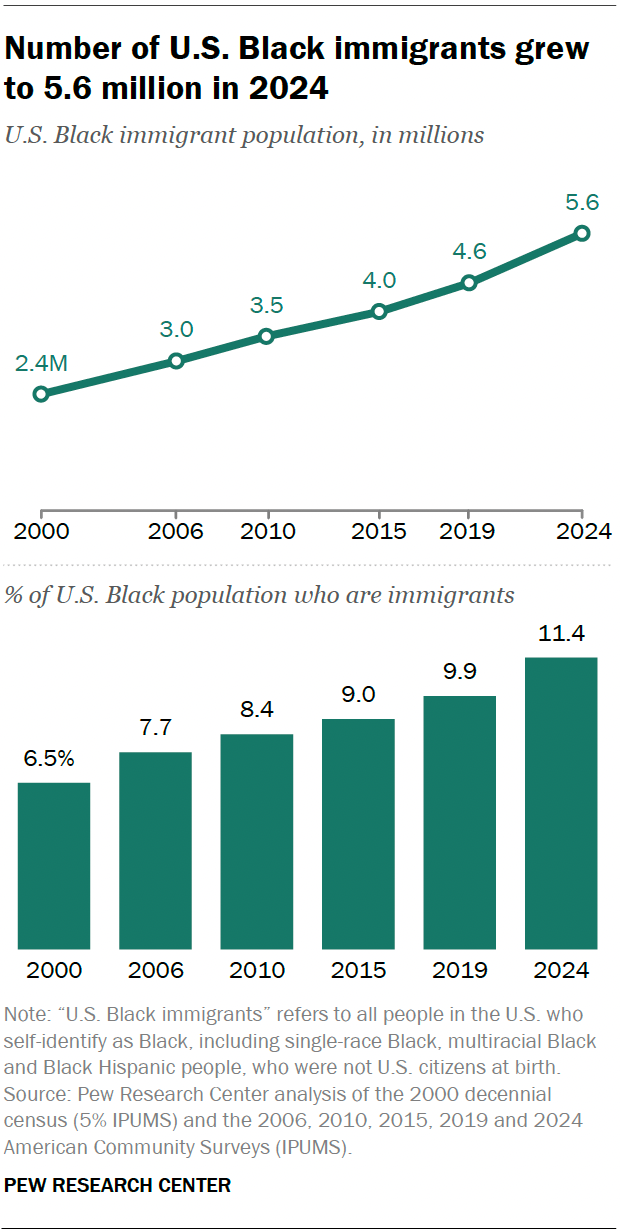
The Black immigrant population has more than doubled since 2000. The number of Black immigrants living in the U.S. reached 5.6 million in 2024, up from 2.4 million in 2000. This gain accounted for a quarter of the growth in the overall Black population, which increased by 13 million during the same period.
Black immigrants are 11.4% of the total U.S. Black population. They also make up 11.2% of all U.S. immigrants.
A quarter of Black Americans are immigrants or the children of immigrants. Combined, 25% of Black people either are immigrants themselves or are U.S. born with at least one immigrant parent, according to a Center analysis of the Census Bureau’s 2025 Current Population Survey. This is similar to the share for White Americans (24%), but it’s much lower than the shares for Hispanic (66%) or Asian Americans (86%).
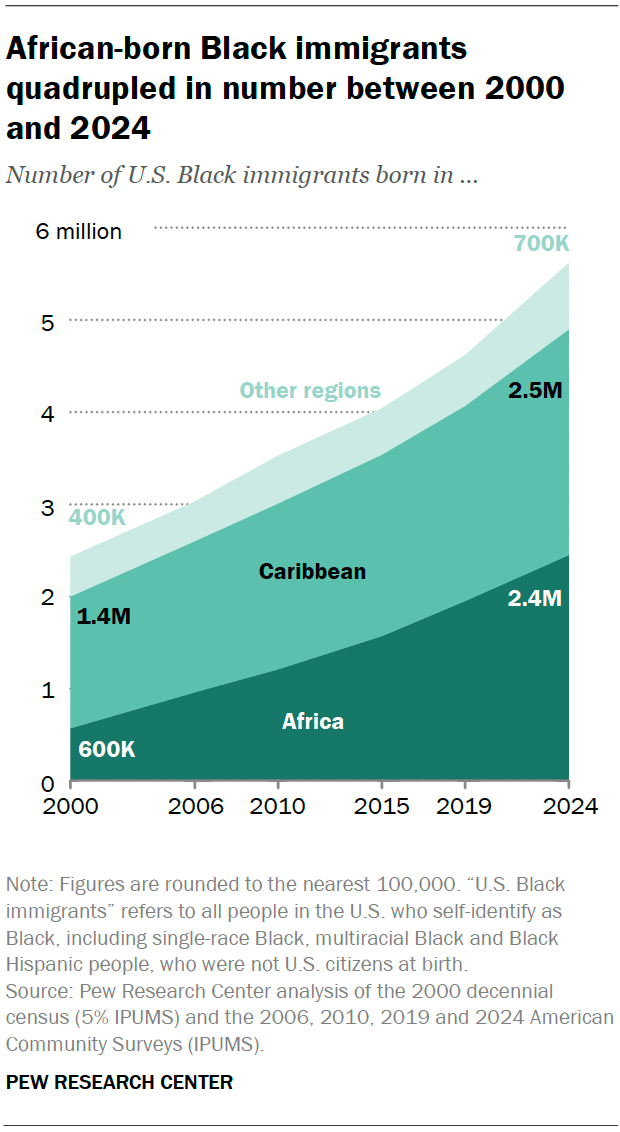
African-born immigrants are the fastest-growing Black immigrant group in the U.S. Between 2000 and 2024, the number of African-born Black immigrants increased fourfold, from about 600,000 to 2.4 million. They now make up 44% of all Black immigrants in the U.S., up from just 24% in 2000.
This is similar to the share of Black immigrants born in the Caribbean – 44%, or 2.5 million people.
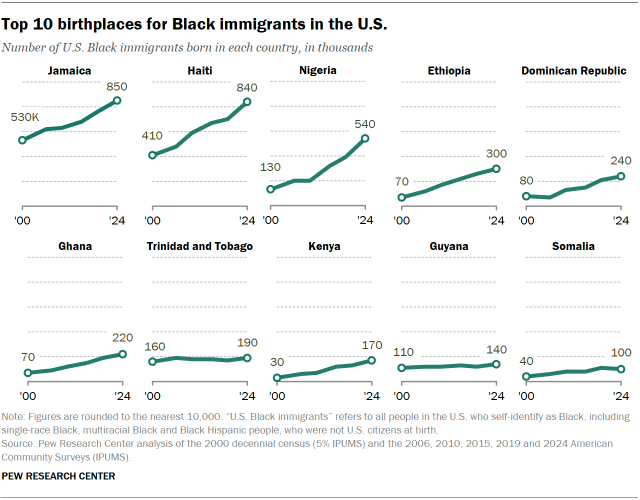
Jamaica, Haiti and Nigeria are the top countries of birth for U.S. Black immigrants. Four-in-ten Black immigrants were from these countries in 2024.
Almost all of the top 10 birthplaces for Black immigrants are in Africa or the Caribbean. Immigrants from these 10 countries made up 64% of all U.S. Black immigrants in 2024.
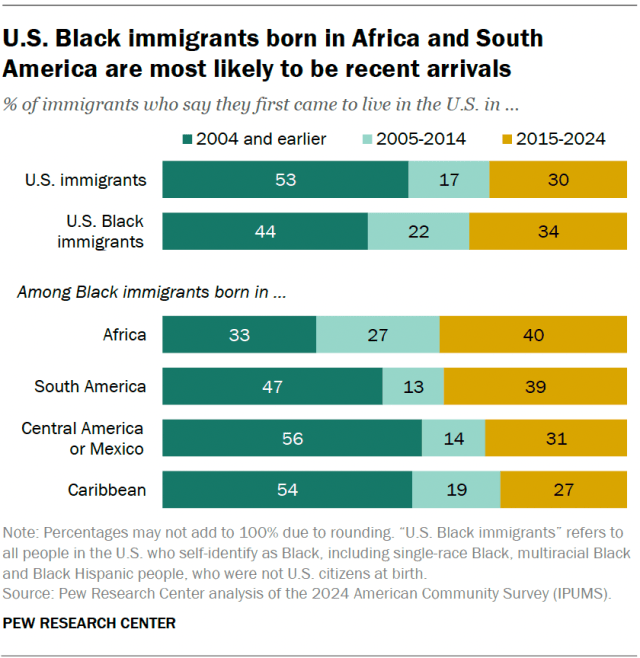
Black immigrants are more likely than U.S. immigrants overall to be recent arrivals. Some 34% of Black immigrants arrived in the U.S. between 2015 and 2024, compared with 30% of U.S. immigrants overall.
African- and South American-born Black immigrants are especially likely to be recent arrivals. Respectively, 40% and 39% immigrated to the U.S. in 2015 or later. Lower shares of Black immigrants from other regions arrived in this time span.
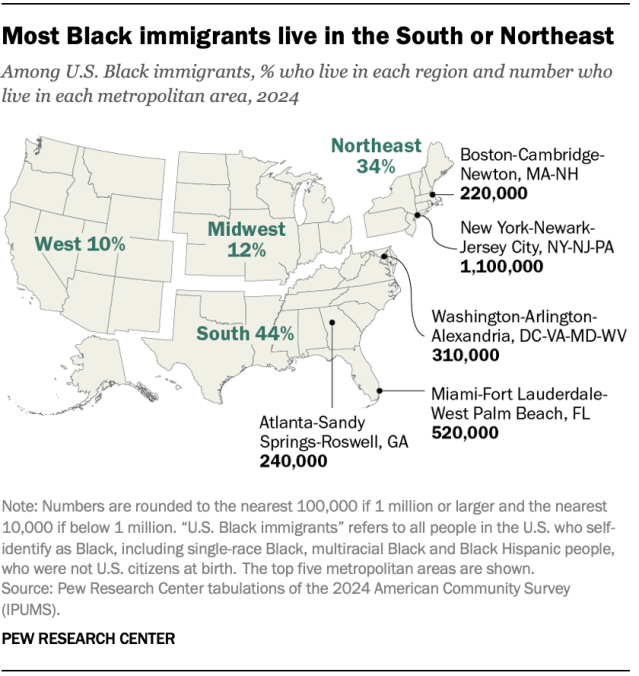
New York City has the most Black immigrants of any metropolitan area – about 1.1 million in 2024. The Miami metro area has the second-most Black immigrants (520,000), followed by Washington, D.C. (310,000). Other top metro areas for Black immigrants include Atlanta, Boston, Houston and Dallas.
Large shares of Black immigrants from specific countries live in certain metropolitan areas. For example:
- 58% of Guyana-born Black immigrants live in the New York City metro area.
- 29% of Haitian-born Black immigrants live in the Miami area.
- 27% of Somalian-born Black immigrants live in the Minneapolis-St. Paul area.
Regionally, most Black immigrants live in either the South (44%) or Northeast (34%). The Midwest and West are home to 12% and 10%, respectively.
In 2023, most Black immigrants (79%) were in the U.S. legally, while 21% were unauthorized, according to the most recent Pew Research Center estimates. The share of Black immigrants who were in the country without authorization was smaller than the share for U.S. immigrants overall (27%).
The number of U.S. Black immigrants who were unauthorized reached an all-time high in 2023, as did the total number of unauthorized immigrants. To learn how the unauthorized immigrant population has changed since then, read our 2025 report.
A majority of Black immigrants are U.S. citizens. About six-in-ten Black immigrants (61%) were naturalized U.S. citizens in 2024, up from 44% in 2000. That compares with 51% of all U.S. immigrants who are naturalized citizens.
The share of Black immigrants who are naturalized citizens varies by what region of the world they were born in. Majorities of those born in the Caribbean (64%), Africa (59%) and South America (55%) are naturalized. Meanwhile, 43% of those born in Central America or Mexico have become U.S. citizens.
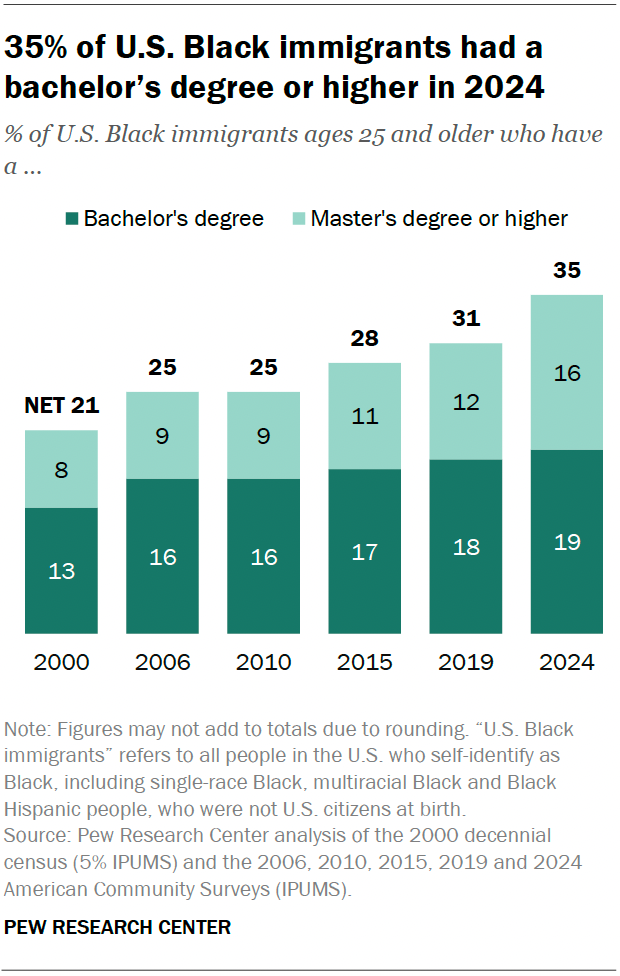
An increasing share of Black immigrants have a college degree or more education. In 2024, 35% of Black immigrants ages 25 and older had a bachelor’s degree or higher. That was up from 21% in 2000.
Black immigrants’ educational attainment differs significantly by where they were born. Nigerian-born Black immigrants are the most likely to have a college degree (67%), while Mexican-born Black immigrants are among the least likely (13%).
Overall, Black immigrants are about as likely as immigrants overall (36%) to have a college degree. But they are more likely than U.S.-born Black adults (26%) to have one.
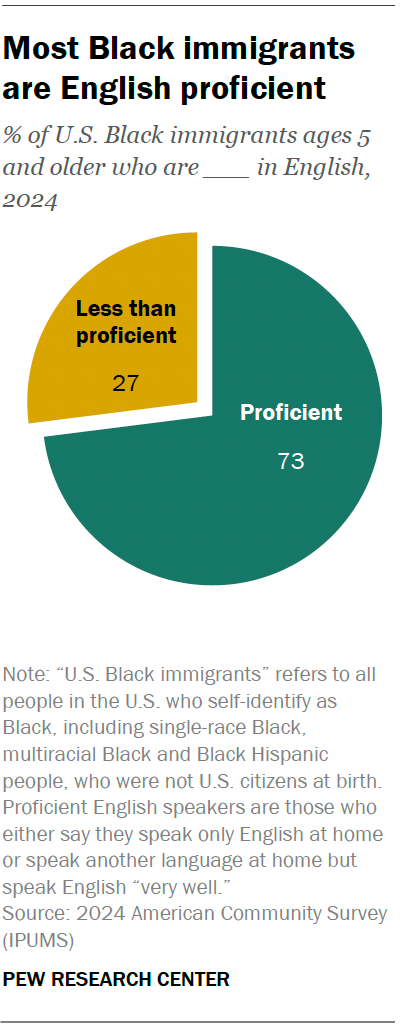
A large majority of Black immigrants ages 5 and older (73%) spoke English proficiently as of 2024. That means they either spoke only English at home or said they speak it “very well.” This is down slightly from 2000, when 77% of Black immigrants were proficient in English.
Black immigrants are much more likely than immigrants overall (53%) to speak English proficiently.
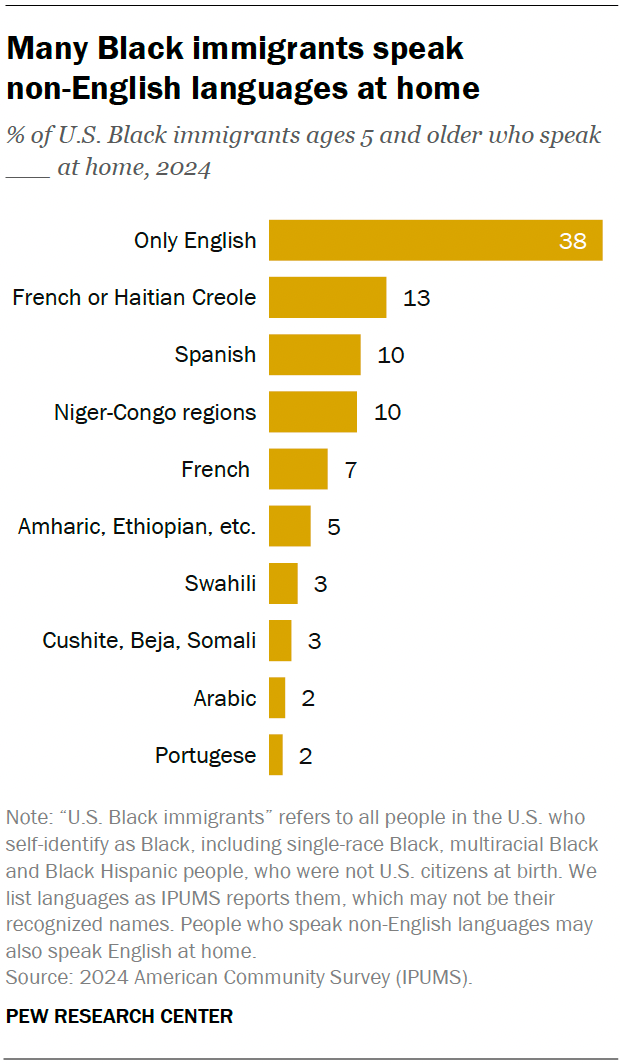
Regardless of their English proficiency, it’s common for Black immigrants to speak a non-English language at home. Among those ages 5 and older, 62% did so in 2024, while 38% spoke only English.
Some of the most common non-English languages spoken were:
- French or Haitian Creole (13%)
- Spanish (10%)
- Niger-Congo languages (10%)
Note: This is an update of a post originally published on Jan. 24, 2018. A 2020 version was written by former Research Analyst Christine Tamir.

