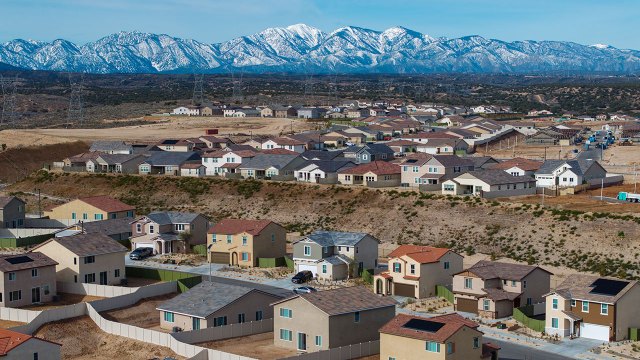
Americans have long expressed a modest preference for communities with bigger houses – even if that means schools, stores and restaurants are farther away – over communities with smaller houses that are closer to those services.
| Year | Smaller and closer to each other | Larger and farther apart |
|---|---|---|
| 2019 | 47% | 53% |
| 2021 | 39% | 60% |
| 2023 | 42% | 57% |
| 2026 | 44% | 55% |
In a Pew Research Center survey from January:
- 55% of U.S. adults say they would prefer to live in a community where “houses are larger and farther apart, but schools, stores and restaurants are several miles away.”
- 44% would prefer a community where “houses are smaller and closer to each other, but schools, stores and restaurants are within walking distance.”
The share of adults who prefer a more spread-out community is about what it was in 2023 (57%). But it’s down from July 2021, when 60% of Americans said during the COVID-19 pandemic they prefer more spread-out communities.
As in the past, these preferences also differ by race and ethnicity, age, education, party and community type.
Race and ethnicity

Note: White, Black and Asian adults include only those who report being only one race and are not Hispanic. Hispanics are of any race. No answer responses are not shown.
| Population | Group | Smaller and closer to each other | Larger and farther apart |
|---|---|---|---|
| Total | Total | 44% | 55% |
| White | Race/Ethnicity | 40% | 59% |
| Black | Race/Ethnicity | 52% | 47% |
| Hispanic | Race/Ethnicity | 48% | 52% |
| Asian* | Race/Ethnicity | 69% | 31% |
| Ages 18-29 | Age | 54% | 46% |
| 30-49 | Age | 42% | 57% |
| 50-64 | Age | 38% | 62% |
| 65+ | Age | 47% | 52% |
| Postgrad | Education | 53% | 47% |
| College grad | Education | 47% | 52% |
| Some college | Education | 41% | 58% |
| High school or less | Education | 42% | 58% |
| Rep/Lean Rep | Rep/Lean Rep | 28% | 71% |
| Conservative | Rep/Lean Rep | 26% | 74% |
| Moderate/Liberal | Rep/Lean Rep | 33% | 67% |
| Dem/Lean Dem | Dem/Lean Dem | 60% | 40% |
| Conservative/Moderate | Dem/Lean Dem | 54% | 46% |
| Liberal | Dem/Lean Dem | 68% | 31% |
| Urban | Community | 61% | 39% |
| Surburban | Community | 45% | 55% |
| Rural | Community | 29% | 70% |
Note: White, Black and Asian adults include only those who report being only one race and are not Hispanic. Hispanics are of any race. No answer responses are not shown.
Nearly six-in-ten White adults (59%) say they would prefer to live in a more spread-out community with larger houses. By comparison, nearly seven-in-ten Asian adults (69%) would prefer a more walkable community with smaller houses.
Black and Hispanic adults are about evenly divided in their preferences.
Age
Across all age groups, only 18- to 29-year-olds are more likely to say they’d prefer a more walkable community to a more spread-out one. Americans ages 30 to 64 are the most likely to say they’d prefer a spread-out community with larger homes, though 52% of those 65 and older also say this.
Education
About six-in-ten Americans with some college experience or less education (58%) say they would prefer a more spread-out community, compared with 52% of those with a bachelor’s degree and 47% of those with a postgraduate degree.
Partisanship
Republicans have consistently been more likely than Democrats to say they’d prefer to live in a more spread-out community with larger houses. Today, 71% of Republicans and Republican-leaning independents say this would be their preference. By comparison, a 60% majority of Democrats and Democratic leaners would opt for a community with smaller houses that are closer to schools, stores and restaurants.
Ideology
About three-quarters of conservative Republicans (74%) say they would prefer a more spread-out community with larger houses, as do 67% of moderate and liberal Republicans. Meanwhile, majorities of conservative and moderate Democrats (54%) and liberal Democrats (68%) say they’d prefer a more walkable community with smaller houses.
Community type
Seven-in-ten Americans who describe the place where they currently live as rural say they would prefer to live in a community where houses are larger and farther apart, but also farther from schools, stores and restaurants. A smaller majority of suburban Americans (55%) would prefer this.
By contrast, 61% of Americans who currently live in an urban area say they would prefer a community with smaller houses that are within walking distance of schools, stores and restaurants.
Community type and partisanship
Republicans are more likely than Democrats to live in rural areas, and Democrats are more likely to live in urban areas. But there are partisan differences in preferences across community types.

| Community type | Total | Rep/Lean Rep | Dem/Lean Dem |
|---|---|---|---|
| Urban | 39% | 55% | 30% |
| Suburban | 55% | 69% | 42% |
| Rural | 70% | 84% | 51% |
Among urban, suburban and rural residents alike, Republicans are consistently more likely than Democrats to want to live somewhere with houses that are larger and more spread out. For example:
- 84% of rural Republicans and 51% of rural Democrats prefer this.
- 55% of urban Republicans and 30% of urban Democrats say the same.
Note: Here are our survey questions, the detailed responses and the survey methodology. This is an update of a post originally published Aug. 26, 2021, written by former Research Assistant Vianney Gómez.
