Americans have long been frustrated with the two major political parties. A sizable share – 37% – continue to say they wish there were more parties to choose from, according to a recent Pew Research Center survey of 10,357 U.S. adults.
Who wishes there were more parties?
Age differences
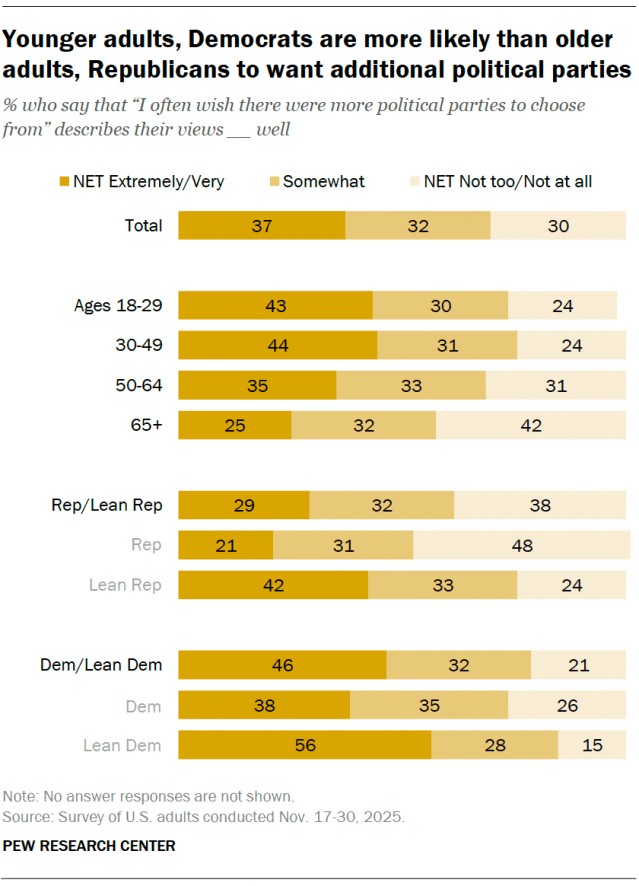
Among adults ages 18 to 49, 44% say their views are described extremely or very well by the phrase, “I often wish there were more political parties to choose from.” This share drops to 35% of those 50 to 64, and 25% of those 65 and older.
Partisan differences
Democrats and Democratic-leaning independents are more likely than Republicans and GOP leaners to say they want more parties (46% vs. 29%). This split is similar to the last time we asked this question in 2023.
In both coalitions, those who identify as independents are more likely than partisans to say they wish there were more parties. But this is especially true of Democratic leaners: 56% say this, compared with 42% of Republican leaners. This pattern was the same in 2023.
Age differences within each party
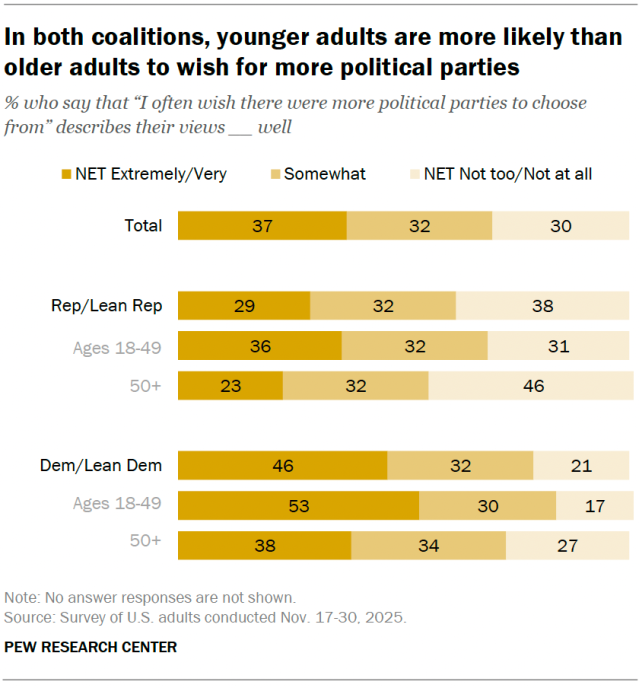
In both parties, younger adults are more likely than older adults to say they wish there were more parties to choose from.
About a quarter of Republicans 50 and older (23%) wish there were more parties to choose from. That rises to 36% of adults under 50.
Similarly, 38% of older Democrats and 53% of younger Democrats say they would like more parties.
Note: Here are the questions used for this analysis, the topline and the survey methodology.
