
Divorce is an important aspect of family life in the United States that shapes living arrangements, financial well-being and parenting. In 2023, over 1.8 million Americans divorced. Additionally, a third of Americans who have ever been married have also experienced divorce.
Many adults who divorce go on to form new families through cohabitation, remarriage or having more children. For instance, most adults who have divorced (66%) have gone on to remarry. And among those who have divorced and are currently remarried, 46% have had a child with their new spouse.
Here are eight facts about divorce in the United States, based on a Pew Research Center analysis of federal data.
Divorce has been declining since the early 1980s, according to a measure known as the refined divorce rate.
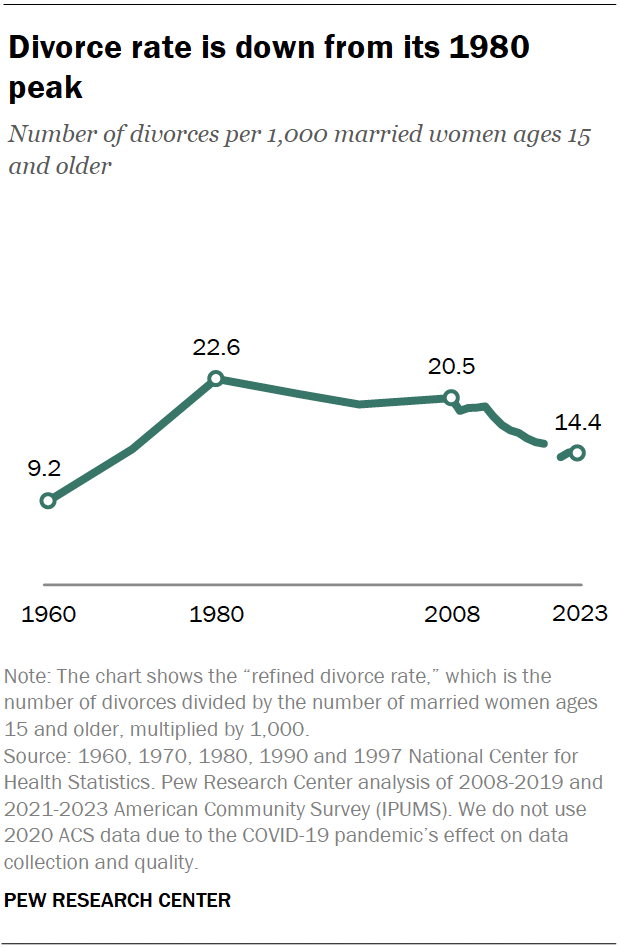
The refined divorce rate is the number of divorces divided by the number of married women ages 15 and older, multiplied by 1,000. This rate differs from the overall divorce rate, which measures divorces per 1,000 women, regardless of marital status.
We use the refined divorce rate because it accounts for changes in the number of people who are married at any given time. This is especially important as marriage rates have declined in recent decades.
The refined divorce rate in the U.S. peaked around 1980, at 22.6 divorces per 1,000 married women, before falling slightly to 20.5 in 2008. It has fallen more sharply in the past 15 years, to 14.4 divorces per 1,000 married women in 2023.
Why has the divorce rate declined? One reason has to do with who is most likely to get married these days. Over time, the married population has shifted toward adults with higher levels of education as people with lower levels of education have become less likely to marry. Adults with more education are less likely to divorce, and these shifts have driven down the divorce rate.
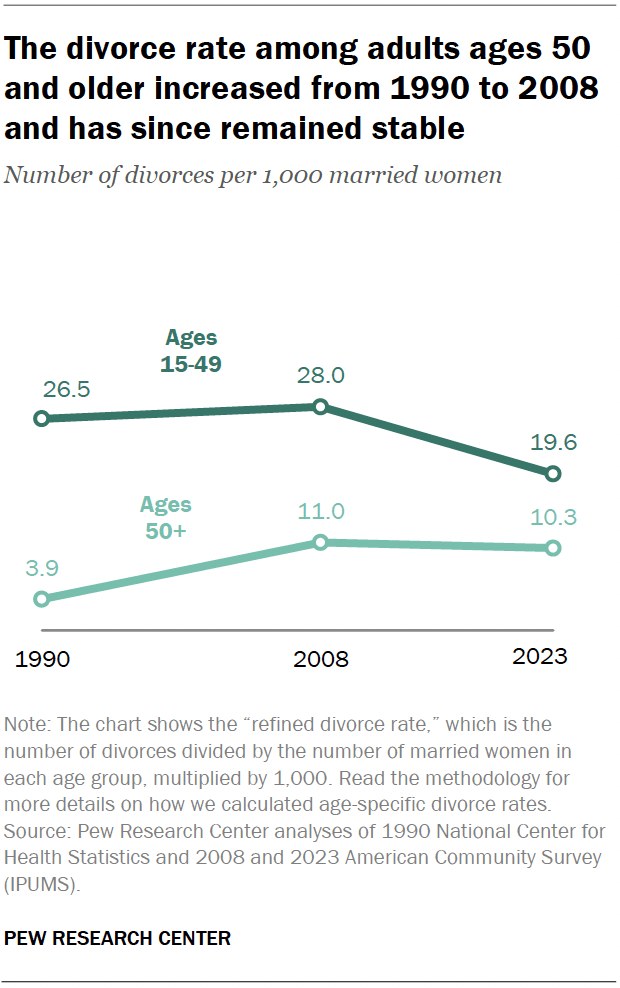
One exception to the divorce decline is “gray divorce,” which rose from 1990 to 2008 and has leveled off recently. Gray divorce refers to the divorce rate among adults ages 50 and older.
In 1990, the divorce rate was 3.9 divorces per 1,000 married women ages 50 and older. By 2008, the divorce rate for this group had risen to 11.0. This stayed relatively stable through 2023, when the divorce rate among older adults was 10.3.
In contrast, the divorce rate for those ages 15 to 49 remained stable from 1990 to 2008 and fell between 2008 and 2023.
Four-in-ten divorces occur in the first decade of marriage; nearly a quarter occur after 25 years.
There is a lot of variation in how long marriages that end in divorce last, but many end in the first decade. Some 16% of divorces in 2023 occurred within the first five years of marriage. Another 24% occurred within five to nine years.
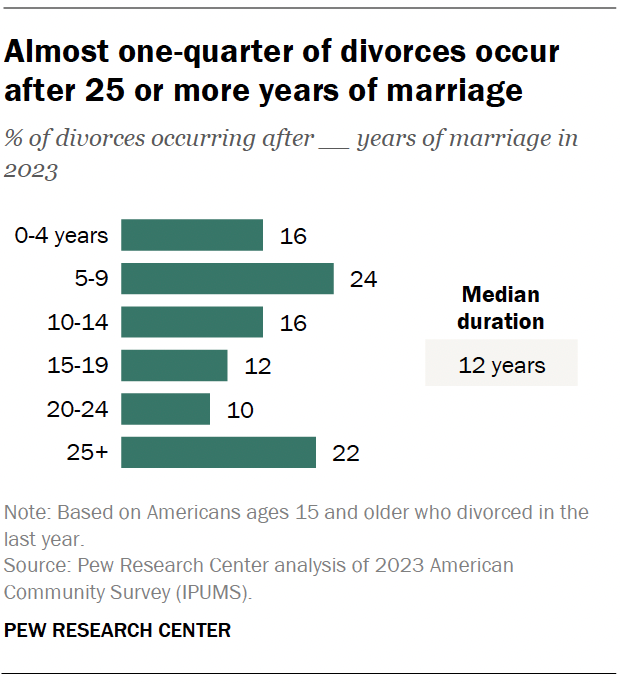
On the other hand, 22% occurred in marriages that had been intact for 25 years or longer.
The median length of marriages that end in divorce has ticked up slightly over time, from 10 years in 2008 to 12 years in 2023.
This data comes from the American Community Survey, which asks all adults about their marital status and the year they were most recently married. As a result, the data excludes divorces in which adults divorced and remarried in the year leading up to the survey. This accounts for 3.3% of divorces.
In 2023, one-third of Americans who had ever been married reported that their first marriage ended in divorce.
This does not mean that 33% of marriages end in divorce. This figure includes some people who are currently married and may divorce in the future.
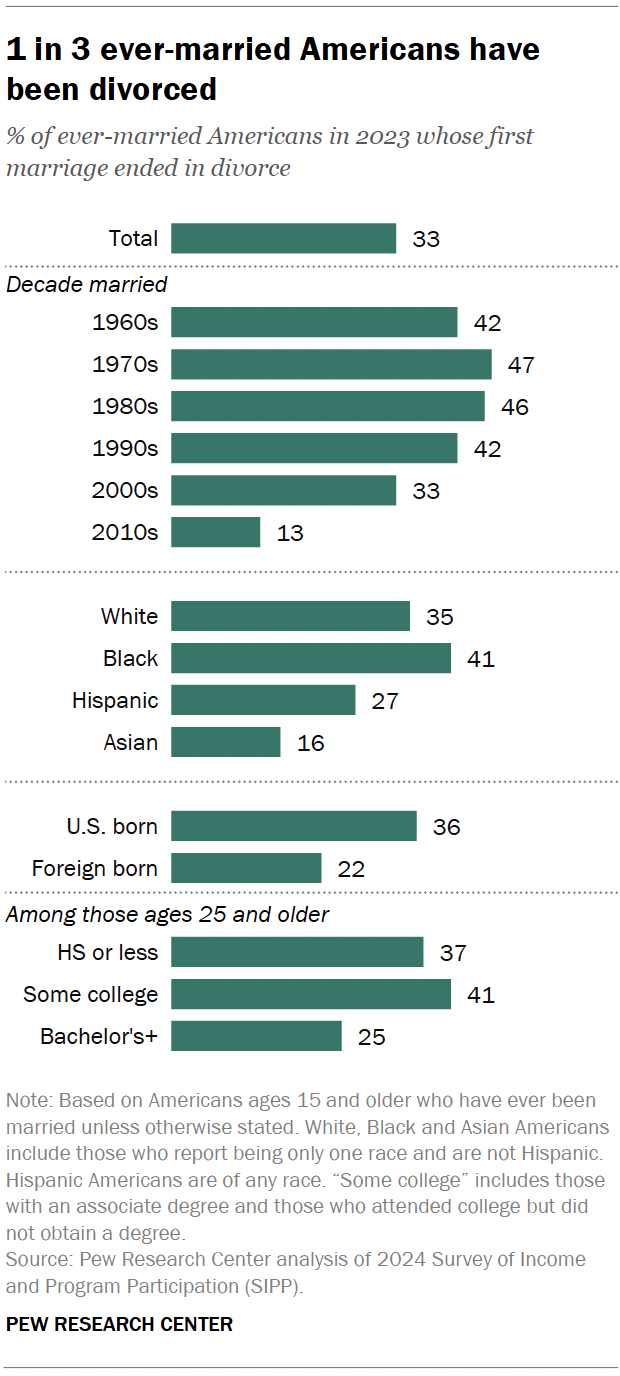
Indeed, the share of Americans who have ever been divorced differs based on when they got married.
Among those who married in the 1960s, 42% experienced divorce by 2023. Some 47% and 46% of adults who wed in the ’70s and ’80s, respectively, had their first marriage end in divorce.
Americans who married in the 1990s or later are less likely to have been divorced as of 2023, though these shares may increase in the future.
The share of Americans who have divorced varies by race and ethnicity, nativity, and education.
Among those who have ever married, Black Americans are the most likely to have gotten divorced (41%). Asian Americans are the least likely (16%).
Americans who were born in the U.S. are more likely than those born outside the U.S. to have ever divorced (36% vs. 22%).
In addition, those with a bachelor’s degree or more education (25%) are less likely than those with a high school degree or less (37%) and those with some college education (41%) to have divorced.
Divorced men are less likely than married men to be employed; the opposite is true for women.
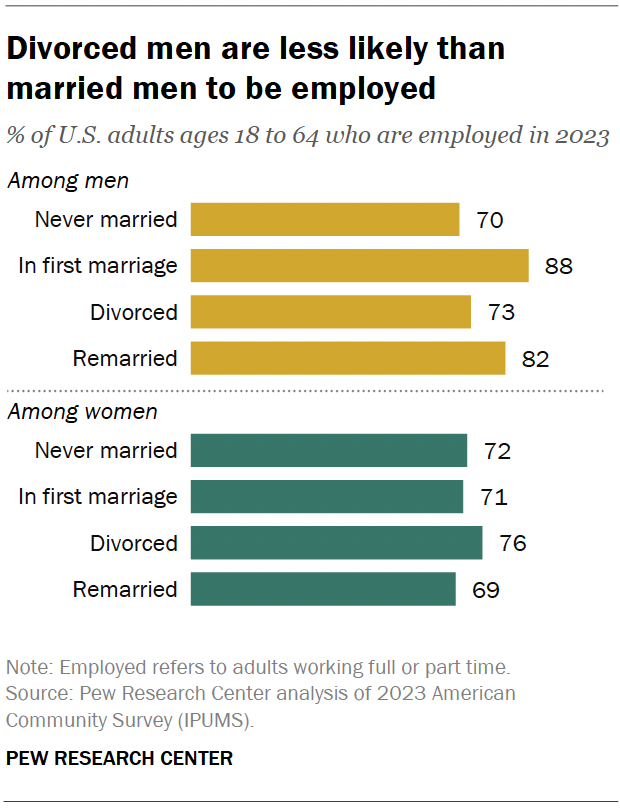
Among working-age adults (those ages 18 to 64), men who are currently divorced and not remarried are less likely than men in their first marriage to be employed (73% vs. 88%). The opposite is true among women: 76% of divorced women are working, compared with 71% of women in their first marriage.
These patterns hold when comparing divorced men and women to those who are remarried.
However, this does not mean divorce leads to unemployment for men. In fact, research shows that unemployed married men are more likely than employed married men to get divorced.
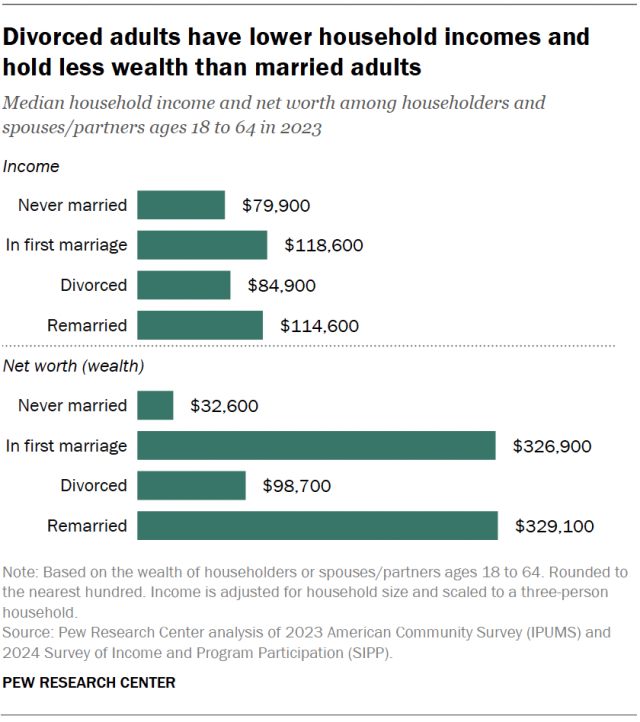
Divorced adults have lower household incomes and less wealth than married adults. Working-age divorced adults have lower median household incomes ($84,900) than married adults, including adults in their first marriage ($118,600) and remarried adults ($114,600).
Working-age adults who are currently divorced also have less median household wealth ($98,700) than those in their first marriage ($326,900) and those who are remarried ($329,100). However, divorced adults have more household wealth than never-married adults ($98,700 vs. $32,600).
About two-thirds of Americans who have divorced have gone on to remarry. There are only small demographic differences in the shares of ever-divorced Americans who have remarried. For example, divorced men are slightly more likely than women to remarry (68% vs. 64%).
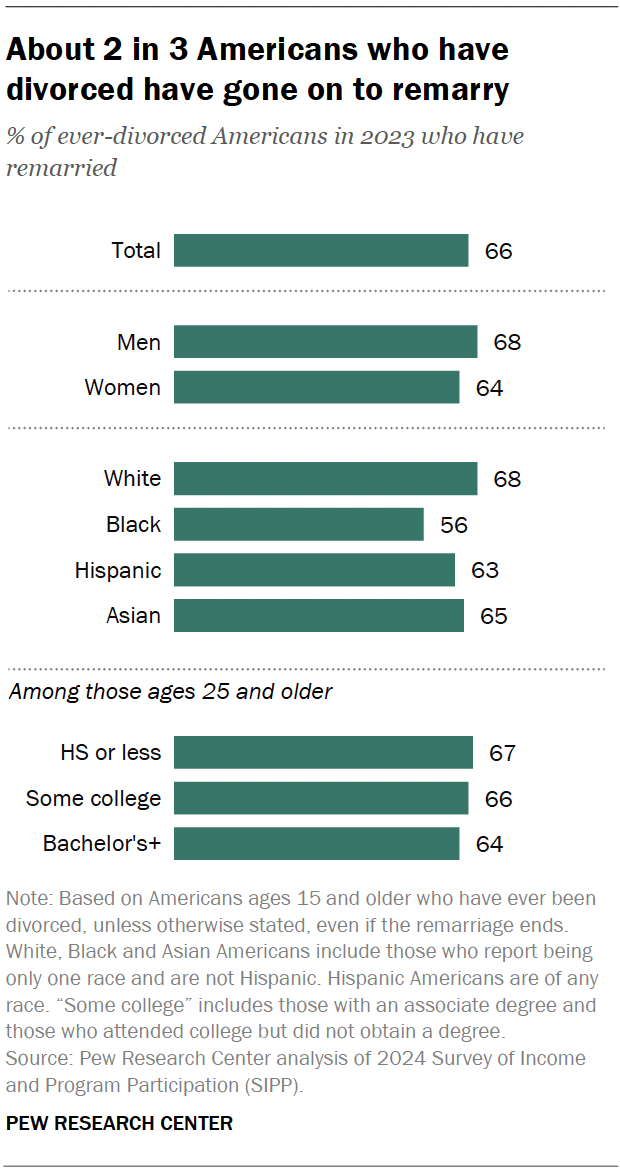
Some previous research has shown that men are more likely to remarry than women, but estimates of remarriage typically look at both widowed and divorced adults. Because widows are less likely than divorced adults to remarry and women are much more likely than men to be widowed, previously married women are less likely to remarry than men. The gender difference isn’t as large when looking only at divorced women and men.
Black Americans who have ever been divorced are less likely than those in other racial and ethnic groups to have ever remarried.
There is not a strong link between education and remarriage among Americans who have divorced.
Some divorced adults who have not remarried live with an unmarried (or cohabiting) partner. In 2023, 15% of divorced women and 19% of divorced men lived with an unmarried partner.
Some 9% of men and 4% of women have a stepchild who they live with, among Americans who have divorced and are currently remarried.
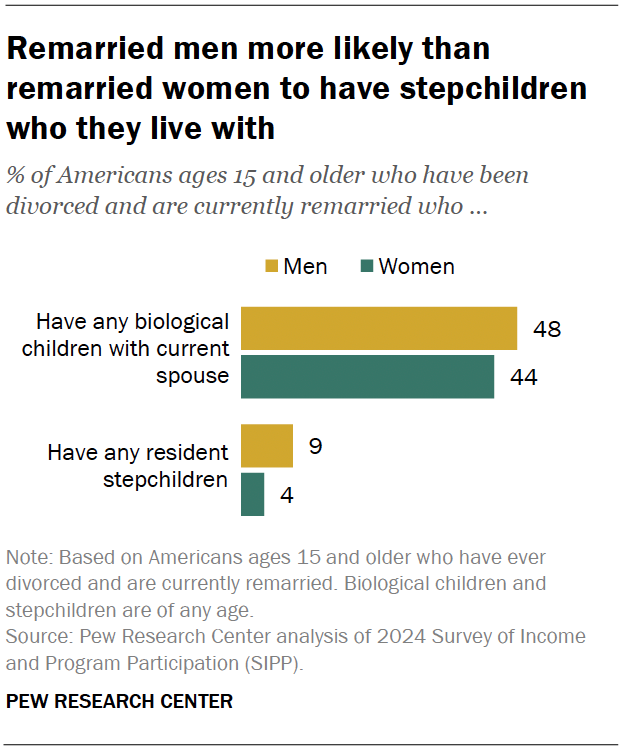
Some 48% of remarried men and 44% of remarried women have biological children with their current spouse. These differences are not statistically significant.
Lower shares of remarried adults have stepchildren who they live with. And remarried men (9%) are more likely than remarried women (4%) to have resident stepchildren.
Note: Read the methodology for more information on the datasets and how specific statistics were calculated.
