
Amid a downbeat economic outlook and sagging consumer confidence, Americans’ views about their personal financial situation have remained relatively stable over the past year.
A majority say they’re in only fair (40%) or poor (17%) shape, according to an April 2025 Pew Research Center survey. Fewer say they’re in excellent (7%) or good shape (36%). This is very similar to how the public felt a year ago.
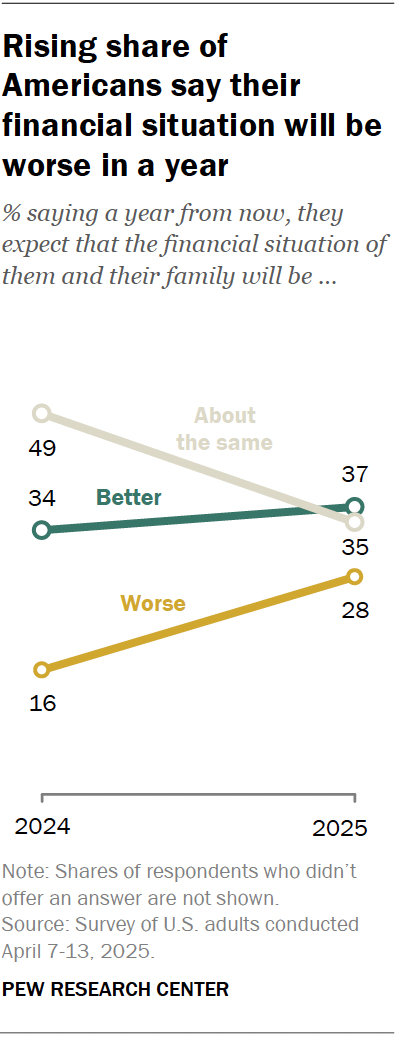
What has changed is the public’s outlook on the future. Roughly three-in-ten adults (28%) say they expect the financial situation for them and their family to be worse a year from now. This is up significantly from 16% who said this in May 2024.
The share of adults who say their situation will be better a year from now has increased only marginally, from 34% in 2024 to 37% today. And the share saying things will be about the same has fallen from 49% to 35%.
Meanwhile, 48% of Americans say they have emergency or rainy day funds that would cover their expenses for three months in case of sickness, job loss, economic downturn or other emergencies.
Views on present circumstances and what might happen in the future differ substantially by income.
- Current situation: Only 20% of lower-income adults say they’re currently in excellent or good shape when it comes to their personal financial situation. This compares with 47% of middle-income adults and 74% of those with upper incomes.
- Future outlook: Looking ahead, 34% of upper-income adults say they expect their financial situation to be worse a year from now. Smaller shares of middle- and lower-income adults say the same (27% and 28%). The share of upper-income adults expressing this level of pessimism has roughly tripled since last year (up from 11%). The increase has been more modest among lower- and middle-income adults.
There are partisan differences as well. Republicans and Republican-leaning independents are more likely than Democrats and Democratic leaners to say their personal finances are in excellent or good shape (49% vs. 38%). But a year ago, Republicans were less likely than Democrats to say this (40% vs. 44%).
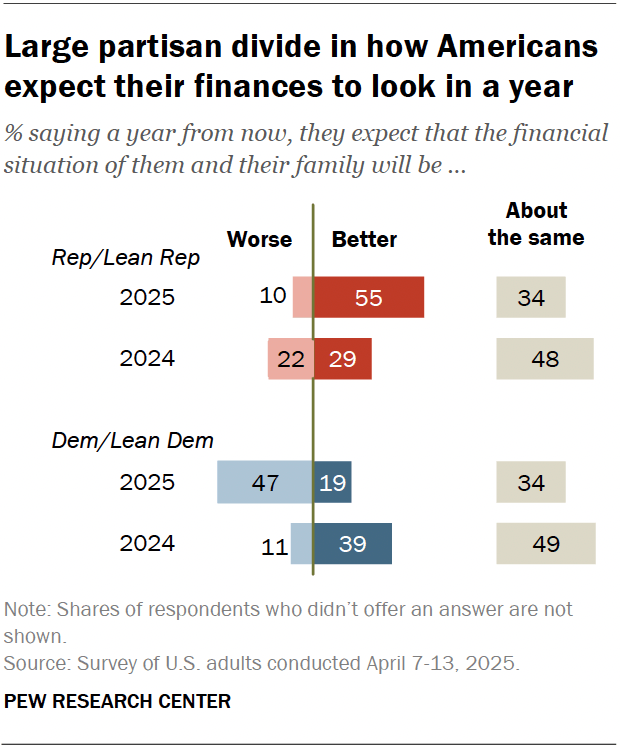
Views about what the next year will bring have changed for both groups.
- Republicans are now more optimistic: 55% say they expect their financial situation will be better a year from now, compared with 29% who said this in 2024.
- Democrats are more pessimistic: 47% of Democrats say they expect their financial situation to be worse in a year, up from 11% in 2024.
Financial pain points for the public
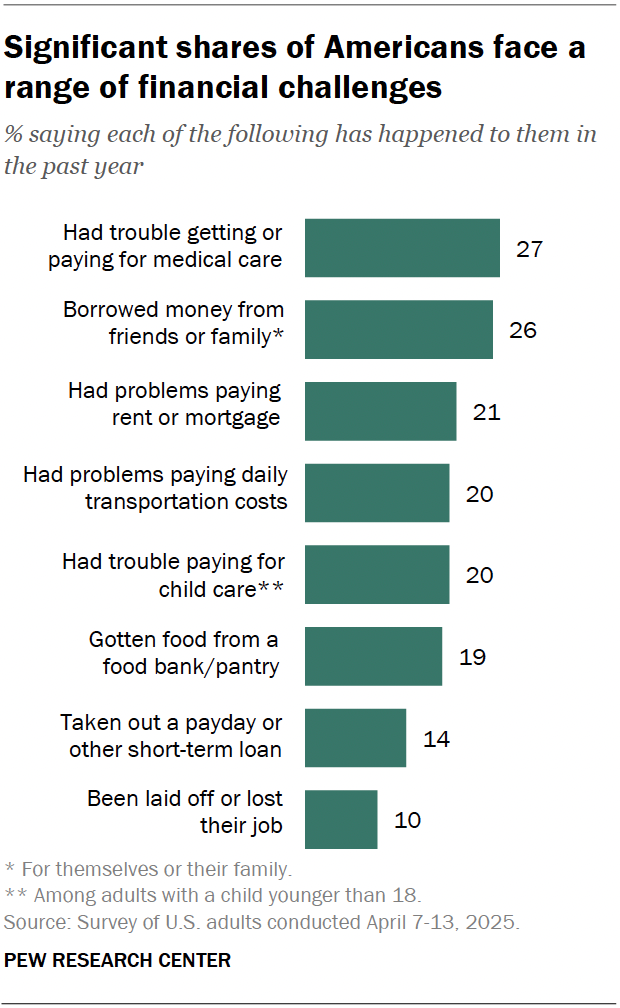
The survey also asked about specific financial challenges Americans are facing. About one-in-four adults say they’ve experienced each of the following in the past year:
- Had trouble paying for medical care for themself or their family (27%)
- Borrowed money from friends or family (26%)
Roughly one-in-five Americans have experienced these things in the past year:
- Had problems paying their rent or mortgage (21%)
- Had problems paying their daily transportation costs (20%)
- Had trouble paying for child care (20% among adults with a child younger than 18)
- Had to get food from a food bank or food pantry (19%)
Smaller shares say they’ve experienced these things:
- Taken out a payday or short-term loan (14%)
- Been laid off or lost their job (10%)
We asked about some of these issues last year, and the findings were similar. However, the share who say they’ve had trouble paying their rent or mortgage has decreased somewhat, from 24% in 2024.
Lower-income adults are much more likely than middle- and upper-income adults to have faced each of these challenges in the past year. For six of the eight challenges we asked about, lower-income adults are about twice as likely as those in the other two income groups to have had these experiences.
For example, 44% of adults with lower incomes say they’ve borrowed money from friends or family in the past year. This compares with 21% of middle-income and 11% of upper-income adults. Similarly, 36% of lower-income adults say they’ve had trouble paying their rent or mortgage, compared with 17% of middle-income and 5% of upper-income adults.
Positive financial experiences
At the same time, many Americans have made financial progress over the past year.
- 47% say they’ve been able to save money for the future (up from 42% in 2024).
- 46% say they’ve gone on a vacation.
- 36% say they’ve gotten a pay raise at their current job or gotten a better job (up from 32% in 2024).
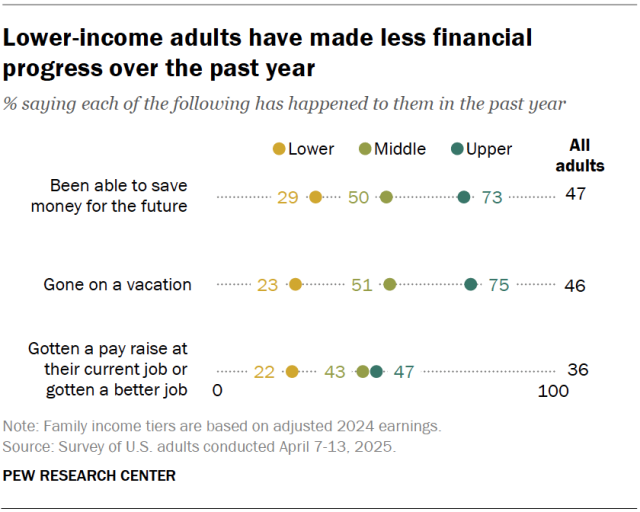
There are large income differences in these experiences, just as there are with financial challenges.
About three-quarters of upper-income adults (73%) say they’ve been able to save money for the future in the past year, compared with 50% of middle-income adults and 29% of lower-income adults. The pattern is similar for taking a vacation.
In addition, upper- and middle-income adults are more likely than lower-income adults to say they’ve gotten a pay raise or a better job in the past year.
Ability to pay monthly bills
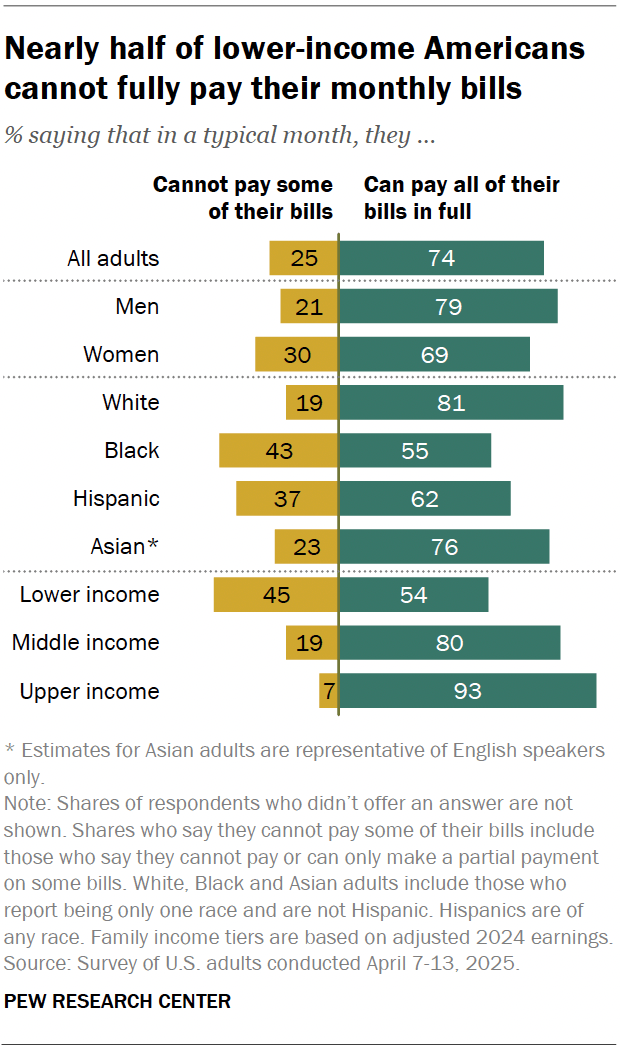
Most Americans (74%) say they can pay all of their bills in a typical month. Still, a quarter say they cannot pay some bills or can only make partial payments.
Some groups are more likely than others to say they can’t pay some of their monthly bills. These include:
- Women: 30% of women say they cannot pay some of their monthly bills. This compares with 21% of men.
- Black and Hispanic adults: 43% of Black adults and 37% of Hispanic adults say they can’t pay some bills, while 23% of Asian adults and 19% of White adults say this.
- Lower-income adults: 45% of lower-income Americans say they can’t pay some bills in a typical month. This compares with 19% of middle-income Americans and 7% of upper-income Americans.
Americans answer similarly when asked about their ability to pay their bills this month. About three-quarters (73%) say they can pay all of their bills, while 26% say they can only pay some of them.
Americans’ ability to pay their bills in a typical month is virtually unchanged from 2020, but they are more likely now than in 2020 to say they can pay their bills this month.
Emergency or rainy day funds
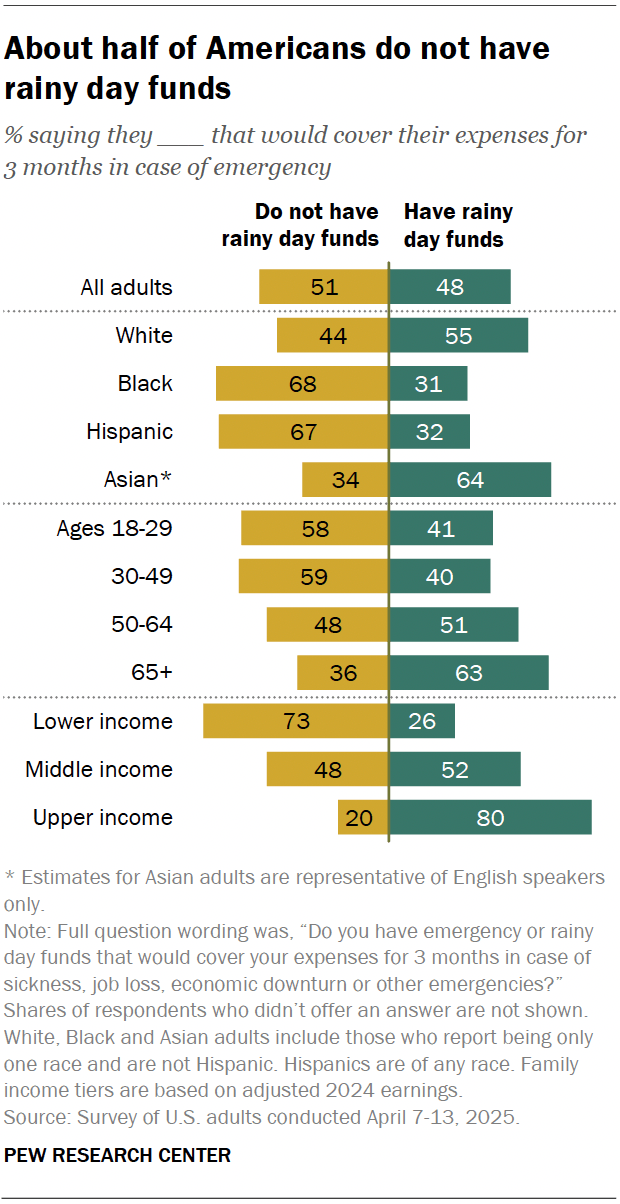
About half of Americans (48%) say they have emergency or rainy day funds that would cover their expenses for three months in case of sickness, job loss, economic downturn or other emergencies.
A similar share (51%) say they do not have these types of funds.
The share of Americans who have rainy day funds differs widely across demographic groups. The following are the least likely to have them:
- Black and Hispanic adults: 68% of Black adults and 67% of Hispanic adults say they do not have rainy day funds, while 44% of White adults and 34% of Asian adults say the same.
- Adults younger than 50: 58% of Americans under 50 say they do not have rainy day funds. This compares with 48% among those ages 50 to 64 and 36% among those 65 and older.
- Lower-income adults: 73% of lower-income adults do not have rainy day funds. This compares with 48% of middle-income and 20% of upper-income adults. In turn, upper-income adults are about three times as likely as lower-income adults to have rainy day funds (80% vs. 26%).
These patterns are largely similar to what they were in 2020.
Note: Here are the questions used for this analysis, the topline and the survey methodology.

