
Note: As of August 2025, the Center’s estimates on the unauthorized immigrant population have been fully updated and revised through 2023. The new figures are published in the report “U.S. Unauthorized Immigrant Population Reached a Record 14 Million in 2023” and supersede all previously published estimates. The post below reflects estimates as they stood in July 2024.
A data release by the Census Bureau in December 2024 may have affected estimates of the size of the unauthorized immigrant population in this blog post. Read this box to learn more.
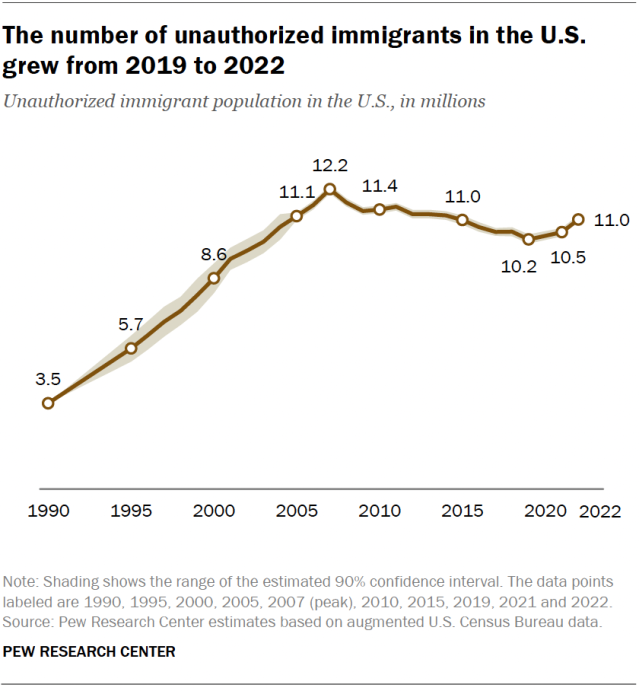
The unauthorized immigrant population in the United States grew to 11.0 million in 2022, according to new Pew Research Center estimates based on the 2022 American Community Survey, the most recent year available. The increase from 10.5 million in 2021 reversed a long-term downward trend from 2007 to 2019. This is the first sustained increase in the unauthorized immigrant population since the period from 2005 to 2007.
However, the number of unauthorized immigrants living in the U.S. in 2022 was still below the peak of 12.2 million in 2007.
Pew Research Center conducted this research to understand changes in the unauthorized immigrant population in the United States. The Center has published estimates of the U.S. unauthorized immigrant population for more than two decades. The estimates presented in this research for 2022 are the Center’s latest.
Center estimates of the unauthorized immigrant population use a “residual method.” It is similar to methods used by the U.S. Department of Homeland Security’s Office of Immigration Statistics and nongovernmental organizations, including the Center for Migration Studies and the Migration Policy Institute. Those organizations’ estimates are generally consistent with ours. Our estimates also align with official U.S. data sources, including birth records, school enrollment figures and tax data, as well as Mexican censuses and surveys.
Our residual method includes these steps:
- Estimate the total number of immigrants living in the country in a particular year using data from U.S. censuses and government surveys such as the American Community Survey and the Current Population Survey.
- Estimate the number of immigrants living in the U.S. legally using official counts of immigrant and refugee admissions together with other demographic data (for example, death and out-migration rates).
- Subtract our estimate of lawful immigrants from our estimate of the total immigrant population. This provides an initial estimate of the unauthorized immigrant population.
Our final estimate of the U.S. unauthorized immigrant population, as well as estimates for lawful immigrants, includes an upward adjustment. We do this because censuses and surveys tend to miss some people. Undercounts for immigrants, especially unauthorized immigrants, tend to be higher than for other groups. (Our 1990 estimate comes from work by Robert Warren and John Robert Warren.)
The term “unauthorized immigrant” reflects many academic researchers’ and policy analysts’ standard and customary usage. The U.S. Department of Homeland Security’s Office of Immigration Statistics also generally uses it. The term means the same thing as “undocumented immigrants,” “illegal immigrants” and “illegal aliens.”
For more details on how we produced our estimates, read the Methodology section of our November 2018 report on unauthorized immigrants.
The unauthorized immigrant population includes any immigrants not in the following groups:
- Immigrants admitted for lawful residence (i.e., green card admissions)
- People admitted formally as refugees
- People granted asylum
- Former unauthorized immigrants granted legal residence under the 1985 Immigration Reform and Control Act
- Immigrants admitted in categories 1-4 who have become naturalized U.S. citizens
- Individuals admitted as lawful temporary residents under specific visa categories, such as those for foreign students, guest workers and intracompany transfers.
Read the Methodology section of our November 2018 report on unauthorized immigrants for more details.
Pew Research Center’s estimate of unauthorized immigrants as of July 2022 includes more than 3 million immigrants who have temporary protection from deportation and permission to be in the United States. Some also have permission to work in the country. These immigrants account for almost 30% of our national estimate of 11.0 million unauthorized immigrants for 2022.
Although these immigrants have permission to be in the country, they could be subject to deportation if government policy changes. Other organizations and the federal government also include these immigrants in their estimates of the U.S. unauthorized immigrant population.
Unauthorized immigrants can receive temporary permission to be in the U.S. through the following:
Individuals who have applied for asylum and are awaiting a ruling are not legal residents but cannot be deported. There are two types of asylum claims, defensive and affirmative.
Defensive asylum applications are generally filed by individuals facing deportation or removal from the U.S. These are processed by the Department of Justice’s Executive Office for Immigration Review (EOIR). As of July 2022, there were about 915,000 individuals with applications pending.
Affirmative asylum claims are made by people who are not in the process of being deported or removed. These claims are handled by the Department of Homeland Security’s U.S. Citizenship and Immigration Services (USCIS). In mid-2022, about 720,000 individuals were awaiting decisions on more than 500,000 applications for affirmative asylum.
As of July 2022, there were about 650,000 unauthorized immigrants with Temporary Protected Status. This status provides protection from removal or deportation to individuals who cannot safely return to their country because of civil unrest, violence or natural disaster.
Deferred Action for Childhood Arrivals (DACA) offers protection from deportation to individuals who were brought to the U.S. as children before 2007. In July 2022, there were about 595,000 active DACA beneficiaries, largely immigrants from Mexico.
Many immigrants in the U.S. apply for visas to gain lawful immigrant status. In some cases, individuals awaiting decisions on these applications can remain in the country.
T and U visas are for victims of trafficking and certain criminal activities, including domestic violence, sexual assault, hate crimes and involuntary servitude. In mid-2022, the backlog for these visas reached 300,000. The individuals in this backlog are considered part of the unauthorized immigrant population.
These new estimates do not reflect events since mid-2022. The U.S. unauthorized immigrant population has likely grown over the past two years, based on several alternative data sources. For example, encounters with migrants at U.S. borders reached record levels throughout 2022-23, and the number of applicants waiting for decisions on asylum claims increased by about 1 million by the end of 2023.
In addition, through December 2023, about 500,000 new immigrants were paroled into the country through two federal programs – the Cuban, Haitian, Nicaraguan and Venezuelan (CHNV) program and Uniting for Ukraine (U4U). Groups like these have traditionally been considered part of the unauthorized immigrant population, but almost none of them appear in the 2022 estimates.
While these new arrivals probably increased the U.S. unauthorized immigrant population, it remains to be seen how much. New arrivals can’t simply be added to the existing estimate because some unauthorized immigrants leave the country every year, some die and some gain lawful status. (For details, read “What has happened with unauthorized migration since July 2022?”)
Updated Jan. 27, 2025, to reflect new Census Bureau estimates affecting the U.S. immigrant population.
Recently released Census Bureau population estimates show that immigrants have been underrepresented in official population estimates used for the 2022 and 2023 American Community Surveys (ACS). According to the bureau’s recent estimates, the U.S. population was larger than the ACS indicated by about 700,000 people in 2022 and almost 2 million, or roughly 0.6%, in 2023. Almost all of the additional people were immigrants, and based on the Census Bureau’s data sources, most would be considered unauthorized immigrants.
The bureau’s notice impacts our unauthorized immigrant estimates for 2022. The estimates shown in this blog post are lower than the bureau’s new estimates. We are working to update our 2022 estimates and are producing new 2023 estimates consistent with the Census Bureau’s new estimates. In addition, the text in this box has been updated to reflect these developments.
Since July 2022, the reference date for our estimates, a large number of new unauthorized immigrants have arrived in the country but have protection from deportation, according to a Pew Research Center review of federal immigration data. The counts in these various categories (mentioned below) cannot simply be added to the estimated unauthorized immigrant population for 2022. Some new immigrants may appear in multiple categories, and there are offsetting changes from outmigration, deaths of unauthorized immigrants and transitions to lawful immigration statuses.
Here are the main groups of unauthorized immigrants with protection from deportation and how the numbers have changed since July 2022:
Asylum applicants. Immigrants who have applied for asylum but whose cases have not been resolved are included in our estimate of the unauthorized immigrant population because they have not been admitted as permanent residents. The number with pending cases has grown substantially since July 2022. Most immigrants in these backlogs are in the United States.
The backlog of affirmative asylum cases (i.e., cases adjudicated by the Department of Homeland Security’s U.S. Citizenship and Immigration Services) increased from about 500,000 as of June 30, 2022, to more than 1.1 million at the end of 2023. Since each case can include more than one person, we estimate that these additional cases added 870,000 immigrants to the backlog at the end of 2023. Most of these people are new arrivals to the U.S.
During this period, the backlog for defensive asylum (i.e., cases adjudicated by the Department of Justice Executive Office for Immigration Review) grew by about 120,000 people, from about 900,000 to 1 million people.
CHNV parolees. A program started in October 2022 allows people living in Cuba, Haiti, Nicaragua and Venezuela to apply to enter the U.S. as parolees. Since these migrants are not admitted for permanent U.S. residence, they would be included in our estimate of the unauthorized immigrant population under current definitions.
The program began full operation in January 2023. By the end of 2023, about 320,000 new immigrants had entered the country under CHNV parole.
Uniting for Ukraine (U4U). Created in April 2022, this program allows Ukrainian citizens and their families to live in the U.S. on a temporary basis under certain conditions. More than 175,000 Ukrainians had been admitted on a two-year parole as of January 2024.
Because these immigrants do not have permanent residence, they would be considered unauthorized immigrants based on current definitions. Virtually all U4U parolees came to the U.S. after July 2022 and are not part of the 2022 unauthorized immigrant population estimate.
Victims of human trafficking and other crimes. T and U visas are available for victims of certain crimes who assist law enforcement in pursuing the criminals. The backlogs for these visas increased by about 50,000 people from July 2022 through December 2023.
Temporary Protected Status (TPS). TPS allows migrants to live and work in the U.S. and avoid deportation because their home countries are unsafe due to war, natural disasters or other crises. Some people with TPS have been in the U.S. for more than 20 years.
The population of immigrants eligible for or receiving TPS recently increased to about 1.2 million. Most of these people were already in the country as of July 2022, so they do not contribute to growth in the unauthorized immigrant population. Further, many newer additions to the TPS population are counted in other groups.
Deferred Action for Childhood Arrivals (DACA). DACA allows unauthorized immigrants who were brought to the U.S. before their 16th birthday and who were in the U.S. on June 15, 2012, to live and work in the country. Initially, about 700,000 individuals received benefits under DACA.
Since then, the number of DACA recipients has dropped steadily as some have acquired permanent status and others have left the country or otherwise not renewed their status. At the end of 2023, about 530,000 people had DACA status. These individuals are in our unauthorized immigrant population estimates for 2022.
In addition to these groups with protection from deportation, there are other indicators of overall growth:
Encounters at U.S. borders. U.S. immigration authorities have encountered a large number of migrants at the border since July 2022. While many migrants are detained and denied entry into the U.S., some are allowed to remain in the U.S. temporarily.
The Census Bureau’s population estimates released in December 2024 directly incorporate two groups from these encounters: U.S. Border Patrol Releases (about 1.6 million additional immigrants from July 2022 through the end of 2023) and Office of Field Operations Paroles (about 550,000 additional migrants). Most of these who are allowed to stay are included in other groups noted above and do not represent additional unauthorized immigrants.
Immigrants in the Current Population Survey (CPS). This government survey provides data on the total U.S. population as well as immigrants, both from the monthly CPS and the Annual Social and Economic Supplement (ASEC) every March. CPS data on the immigrant population shows substantial growth since 2022, beyond what can be accounted for by lawful immigration.
Here are key findings about how the U.S. unauthorized immigrant population changed recently:
- The number of unauthorized immigrants from Mexico dropped to 4.0 million in 2022 from a peak of 6.9 million in 2007. Mexico has long been, and remains, the most common country of birth for unauthorized immigrants.
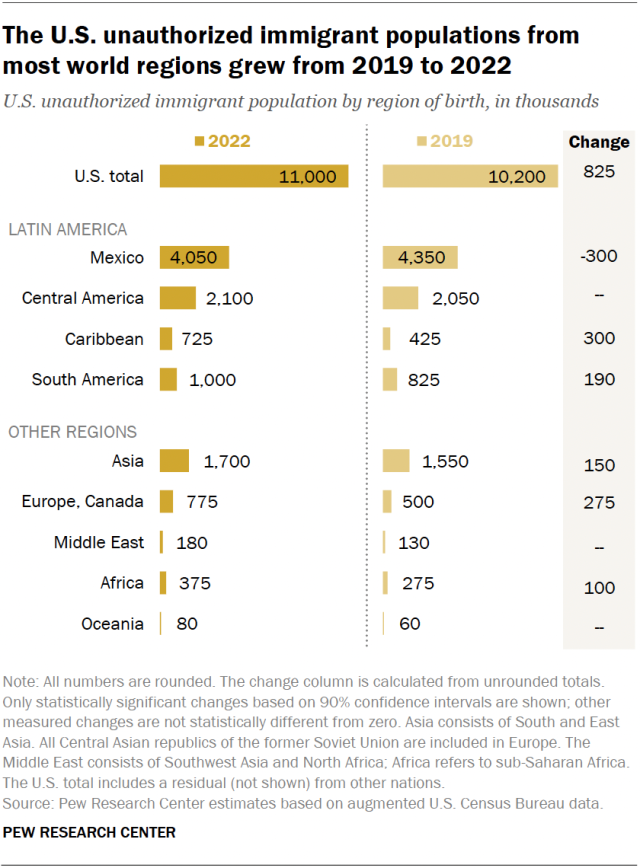
- From 2019 to 2022, the unauthorized immigrant population from nearly every region of the world grew. The Caribbean, South America, Asia, Europe and sub-Saharan Africa all saw increases.
- The unauthorized immigrant population grew in six states from 2019 to 2022 – Florida, Maryland, Massachusetts, New Jersey, New York and Texas. Only California saw a decrease.
- About 8.3 million U.S. workers in 2022 were unauthorized immigrants, an increase from 7.4 million in 2019. The 2022 number is essentially the same as previous highs in 2008 and 2011.
Composition of the U.S. immigrant population
Immigrants made up 14.3% of the nation’s population in 2022. That share was slightly higher than in the previous five years but below the record high of 14.8% in 1890.
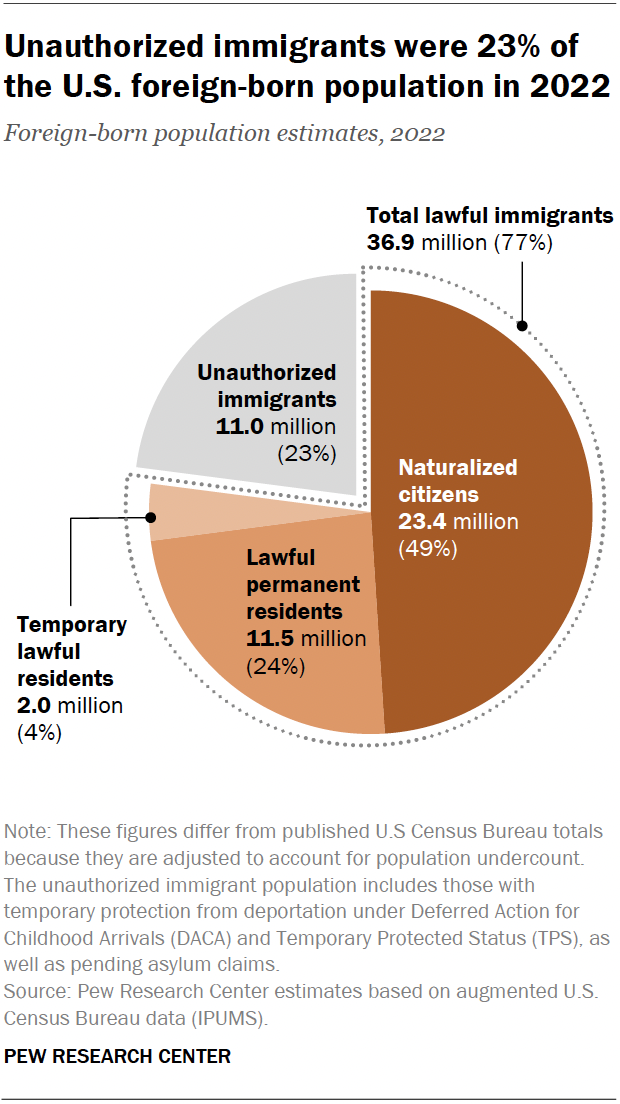
As of 2022, unauthorized immigrants represented 3.3% of the total U.S. population and 23% of the foreign-born population. These shares were lower than the peak values in 2007 but slightly higher than in 2019.
Meanwhile, the lawful immigrant population grew steadily from 24.1 million in 2000 to 36.9 million in 2022. The growth was driven by a rapid increase in the number of naturalized citizens, from 10.7 million to 23.4 million. The number of lawful permanent residents dropped slightly, from 11.9 million to 11.5 million. As a result, in 2022, 49% of all immigrants in the country were naturalized U.S. citizens.
Who lives with unauthorized immigrants?
Unauthorized immigrants live in 6.3 million households that include more than 22 million people. These households represent 4.8% of the 130 million U.S. households.
Here are some facts about these households in 2022:
- In 86% of these households, either the householder or their spouse is an unauthorized immigrant.
- Almost 70% of these households are considered “mixed status,” meaning that they also contain lawful immigrants or U.S.-born residents.
- In only about 5% of these households, the unauthorized immigrants are not related to the householder or spouse. In these cases, they are probably employees or roommates.
Of the 22 million people in households with an unauthorized immigrant, 11 million are U.S. born or lawful immigrants. They include:
- 1.3 million U.S.-born adults who are children of unauthorized immigrants. (We cannot estimate the total number of U.S.-born adult children of unauthorized immigrants because available data sources only identify those who still live with their unauthorized immigrant parents.)
- 1.4 million other U.S.-born adults and 3.0 million lawful immigrant adults.
About 4.4 million U.S.-born children under 18 live with an unauthorized immigrant parent. They account for about 84% of all minor children living with their unauthorized immigrant parent. Altogether, about 850,000 children under 18 are unauthorized immigrants in 2022.
The share of households that include an unauthorized immigrant varies across states. In Maine, Mississippi, Montana and West Virginia, fewer than 1% of households include an unauthorized immigrant. Nevada (9%) has the highest share, followed by California, New Jersey and Texas (8% each).
What countries do unauthorized immigrants come from?
The origin countries for unauthorized immigrants have changed since the population peaked in 2007. Here are some highlights of those changes:
Mexico
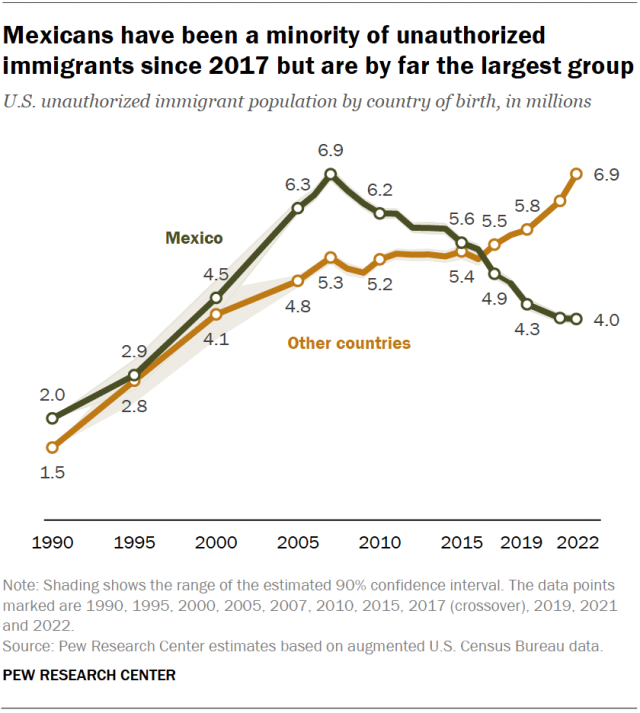
The 4.0 million unauthorized immigrants from Mexico living in the U.S. in 2022 was the lowest number since the 1990s. And in 2022, Mexico accounted for 37% of the nation’s unauthorized immigrants, by far the smallest share on record.
The decrease in unauthorized immigrants from Mexico reflects several factors:
- A broader decline in migration from Mexico to the U.S.;
- Some Mexican immigrants returning to Mexico; and
- Expanded opportunities for lawful immigration from Mexico and other countries, especially for temporary agricultural workers.
The rest of the world
The total number of unauthorized immigrants in the U.S. from countries other than Mexico grew rapidly between 2019 and 2022, from 5.8 million to 6.9 million.
The number of unauthorized immigrants from almost every world region increased. The largest increases were from the Caribbean (300,000) and Europe and Canada (275,000). One exception was Central America, which had led in growth until 2019 but saw no change after that.
After Mexico, the countries with the largest unauthorized immigrant populations in the U.S. in 2022 were:
- El Salvador (750,000)
- India (725,000)
- Guatemala (675,000)
- Honduras (525,000)
The Northern Triangle
Three Central American countries – El Salvador, Honduras and Guatemala – together represented 1.9 million unauthorized immigrants in the U.S. in 2022, or about 18% of the total. The unauthorized immigrant population from the Northern Triangle grew by about 50% between 2007 and 2019 but did not increase significantly after that.
Other origin countries
In 2022, Venezuela was the country of birth for 270,000 U.S. unauthorized immigrants. This population had seen particularly fast growth, from 55,000 in 2007 to 130,000 in 2017. It is poised to grow significantly in the future as new methods of entry to the U.S. are now available to Venezuelans.
Other countries with large numbers of unauthorized immigrants have also seen increases in recent years. Brazil, Canada, Colombia, Ecuador, India, and countries making up the former Soviet Union all experienced growth from 2019 to 2022.
However, other countries with significant unauthorized immigrant populations showed no change, notably China, the Dominican Republic and the Philippines.
Detailed table: Unauthorized immigrant population by region and selected country of birth (and margins of error), 1990-2022 (Excel)
Which states do unauthorized immigrants call home?
Most U.S. states’ unauthorized immigrant populations stayed steady from 2019 to 2022. However, six states showed significant growth:
- Florida (+400,000)
- Texas (+85,000)
- New York (+70,000)
- New Jersey (+55,000)
- Massachusetts (+50,000)
- Maryland (+40,000)
California (-120,000) is the only state whose unauthorized immigrant population decreased.
States with the most unauthorized immigrants
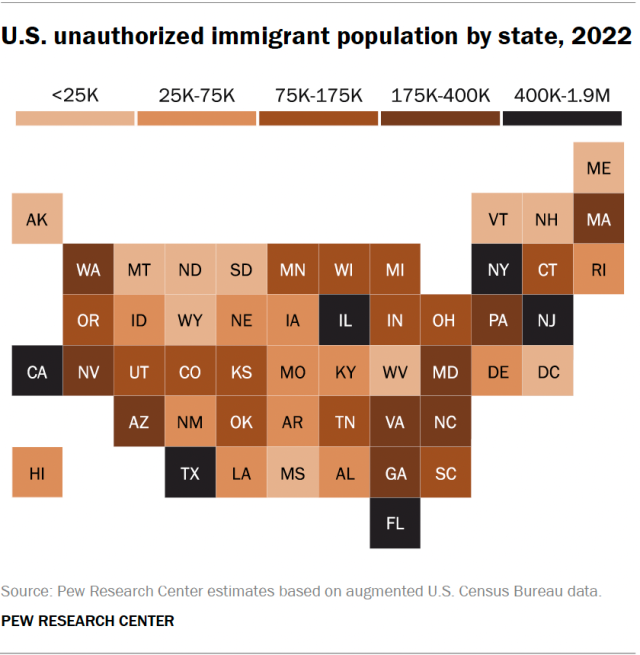
The six states with the largest unauthorized immigrant populations in 2022 were:
- California (1.8 million)
- Texas (1.6 million)
- Florida (1.2 million)
- New York (650,000)
- New Jersey (475,000)
- Illinois (400,000)
These states have consistently had the most unauthorized immigrants since at least 1980. However, in 2007, California had 1.2 million more unauthorized immigrants than Texas. Today, with the declining number in California, it has only about 150,000 more. The unauthorized immigrant population has also become considerably less geographically concentrated over time. In 2022, the top six states were home to 56% of the nation’s unauthorized immigrants, down from 80% in 1990.
Detailed table: Unauthorized immigrant population for states (and margins of error), 1990-2022 (Excel)
Detailed table: Unauthorized immigrants and characteristics for states, 2022 (Excel)
Unauthorized immigrants in the labor force
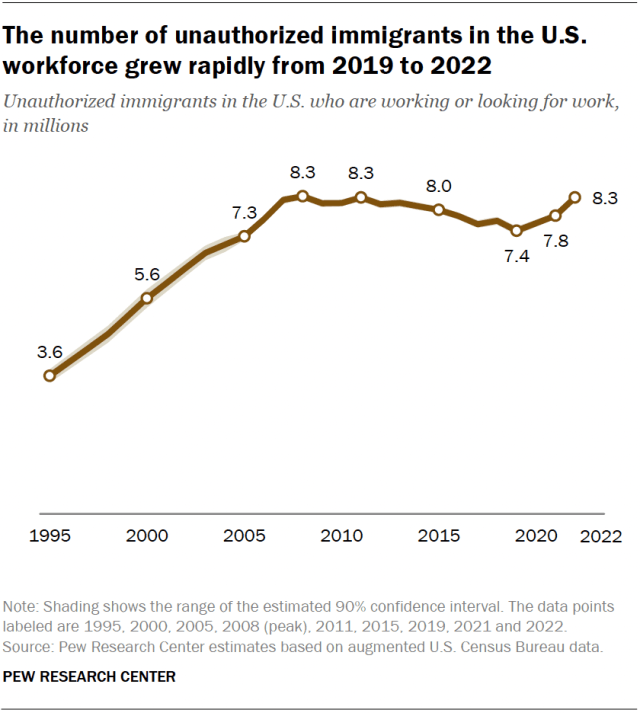
The number of unauthorized immigrants in the U.S. workforce grew from 7.4 million in 2019 to 8.3 million in 2022. The 2022 number equals previous highs in 2008 and 2011.
Unauthorized immigrants represent about 4.8% of the U.S. workforce in 2022. This was below the peak of 5.4% in 2007.
Since 2003, unauthorized immigrants have made up 4.4% to 5.4% of all U.S. workers, a relatively narrow range.
The share of the U.S. workforce made up by unauthorized immigrants is higher than their 3.3% share of the total U.S. population. That’s because the unauthorized immigrant population includes relatively few children or elderly adults, groups that tend not to be in the labor force.
Detailed table: Unauthorized immigrants in the labor force for states, 2022 (Excel)
The share of unauthorized immigrants in the workforce varied across states in 2022. Nevada (9%), Texas (8%), Florida (8%), New Jersey (7%), California (7%) and Maryland (7%) had the highest shares, while fewer than 1% of workers in Maine, Montana, Vermont and West Virginia were unauthorized immigrants.
Note: This is an update of a post originally published Nov. 16, 2023.

