
Nearly 20 million Latino immigrants lived in the United States in 2021, accounting for almost a third (31.8%) of the nation’s total Latino population that year.
Pew Research Center conducted this analysis to explore the demographic characteristics of recent Latino immigrants to the United States, both overall and by individual origin group. Recent immigrants are defined as those who have resided in the U.S. for five years or less at the time of the survey.
The analysis uses microdata from the U.S. Census Bureau’s 2000 decennial census and 2010 and 2021 American Community Surveys, accessed through the Integrated Public Use Microdata Series (IPUMS) from the University of Minnesota. Findings in this analysis are only shown for origin groups with an unweighted sample size of more than 200.
The terms Hispanic and Latino are used interchangeably in this analysis, as are the terms foreign born and immigrant. Foreign born refers to individuals born outside the U.S. who are not U.S. citizens at birth.
In this analysis, Hispanic origin is not the same as birthplace. Origin is determined by Hispanic self-identity. For example, a respondent who identifies as being of Mexican origin may have been born in a country other than Mexico. Hispanics of Puerto Rican origin are included in the analysis of all Hispanics living in the U.S., but not the analyses of Hispanic immigrants living in the U.S. Those born in Puerto Rico are U.S. citizens at birth.
All displayed numbers are rounded. Shares and percent changes are calculated using unrounded numbers.

About 2.6 million of these immigrants arrived in the U.S. in the five years prior to the 2021 American Community Survey – the primary data source for this analysis – but before a recent spike in asylum-seekers at the U.S.-Mexico border.
Here are eight facts about these recently arrived Latino immigrants in the U.S.
The number of recent Hispanic immigrants to the U.S. has declined. In 2000, there were 3.8 million foreign-born Hispanics who had been in the U.S. for five years or less. This number fell to 3 million in 2010 and 2.6 million in 2021.
Meanwhile, the number of Hispanic immigrants who have been in the U.S. for more than five years has grown, from 10.4 million in 2000 to 15.9 million in 2010 and to 17.3 million in 2021.
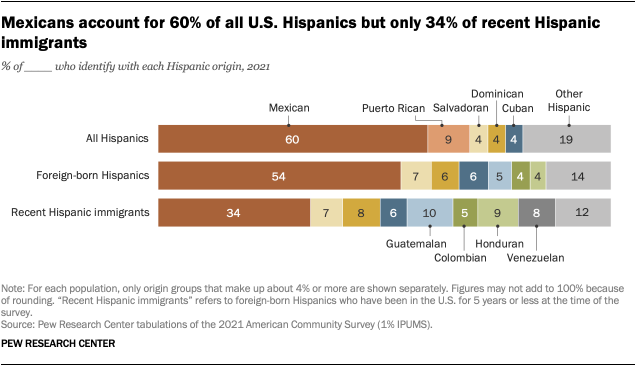
Mexican, Guatemalan, Honduran, Dominican and Venezuelan immigrants make up a large share of the recent Hispanic immigrant population in the U.S.
In 2021, Mexicans made up 34% of the recent Hispanic immigrant population and were the largest group. They are also the largest group among all Hispanic immigrants (54%) and all U.S. immigrants (24%). Even so, the foreign-born Mexican population in the U.S. declined 8.8% since 2010, including a decline in the number of recently arrived Mexicans.
Another 36% of recent Hispanic immigrants to the U.S. are Guatemalan, Honduran, Dominican or Venezuelan. Each of these four groups saw an increase in recent arrivals from 2010 to 2021. For example, the number of Venezuelan immigrants who have lived in the U.S. for five years or less increased from 40,000 in 2010 to 215,000 in 2021.
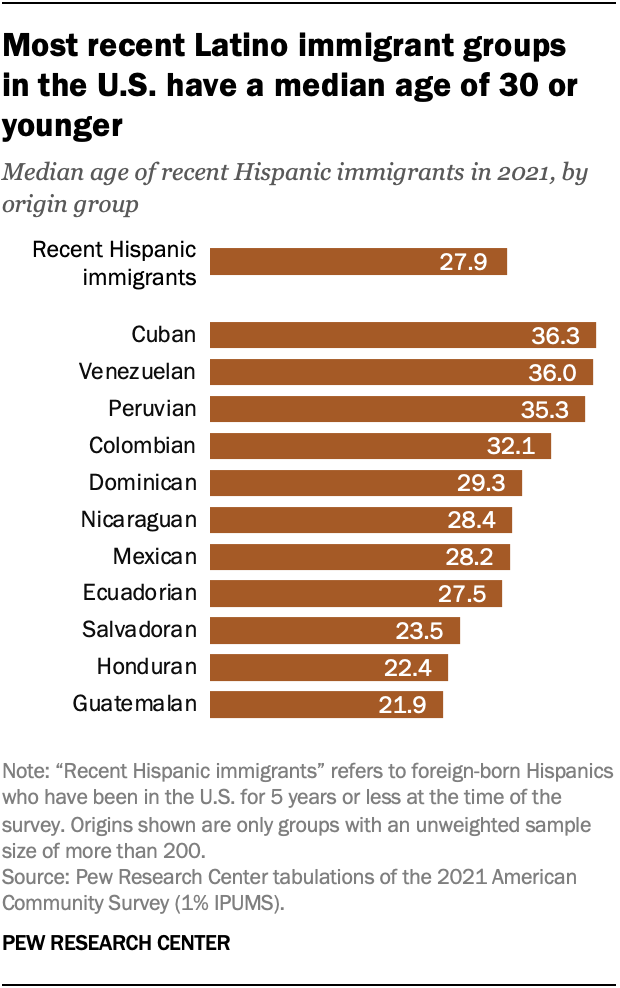
The median age for recent Hispanic immigrants to the U.S. is 27.9 years, though the median varies widely among origin groups. Cubans and Venezuelans have the highest median ages at 36.3 and 36.0 years. The next oldest group is Peruvians at 35.3 years.
Hondurans and Guatemalans are the youngest groups among recent Hispanic immigrants to the U.S., with median ages of 22.4 and 21.9 years, respectively.
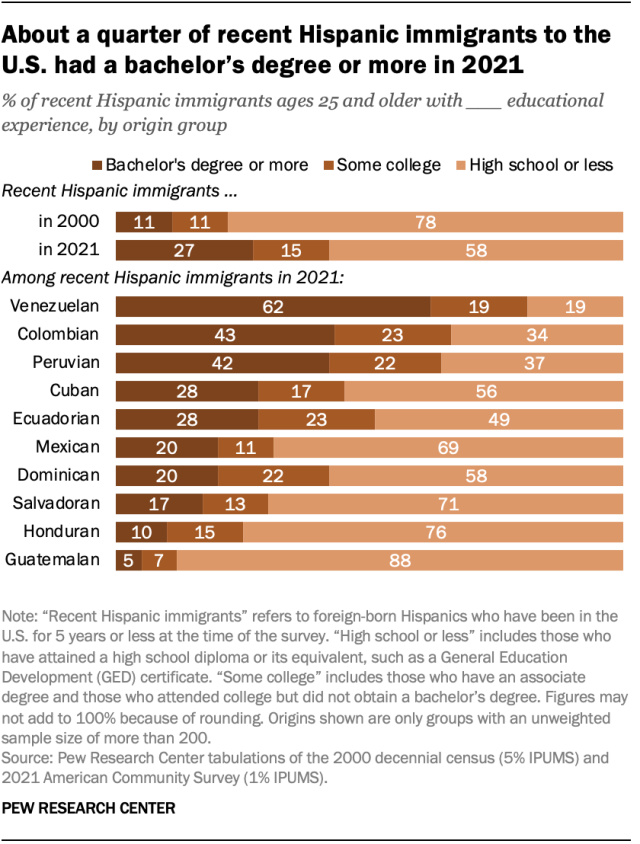
Among recent Hispanic immigrants to the U.S., Venezuelans are the most likely to have a bachelor’s degree. Overall, 27% of recent Hispanic immigrants to the U.S. ages 25 and older have earned at least a bachelor’s degree in the U.S. or elsewhere – up from 11% in 2000.
Around six-in-ten recent Venezuelan immigrants ages 25 and older (62%) have completed at least a bachelor’s degree. The same is true for 43% of recent Hispanic immigrants who are Colombian and 42% of those who are Peruvian.
In contrast, 88% of recent Guatemalan arrivals have no college experience, the highest share among recent Hispanic immigrants. They are followed by recent immigrants from Honduras (76%) and El Salvador (71%).
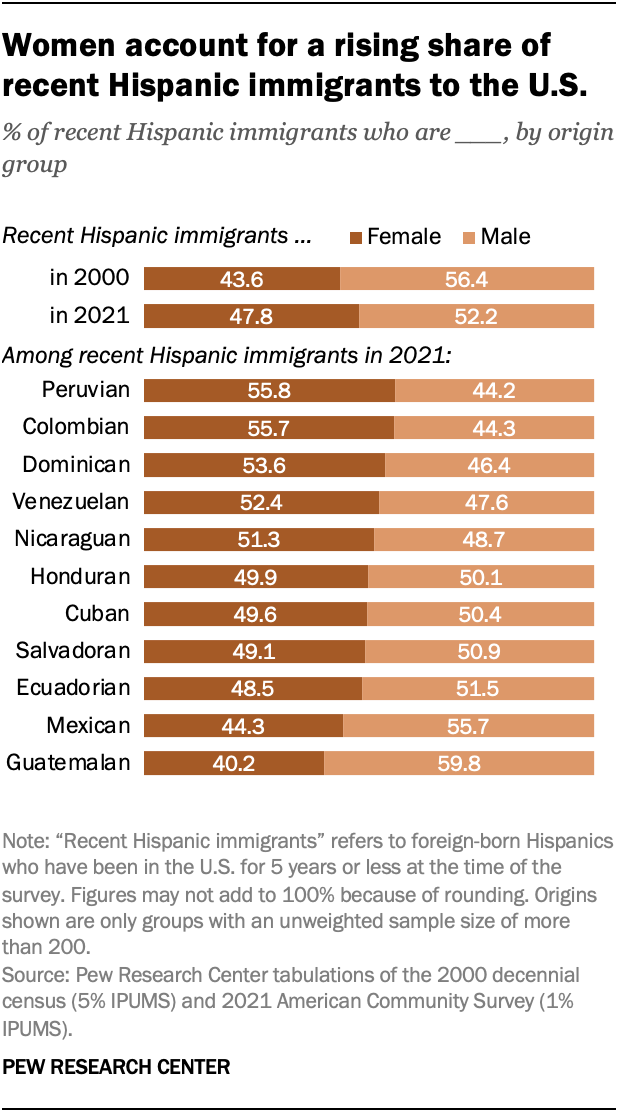
Women represent a growing share of recent Hispanic immigrants to the U.S. and are a majority in some origin groups. In 2021, women made up 47.8% of all recent Hispanic immigrants, up from 43.6% in 2000.
More than half of recent Peruvian (55.8%) and Colombian (55.7%) immigrants to the U.S. are women, the highest shares among recent Hispanic immigrants.
By contrast, 59.8% of recent Guatemalan immigrants are men, the highest share of any origin group. Men also account for more than half of recent Mexican immigrants (55.7%).
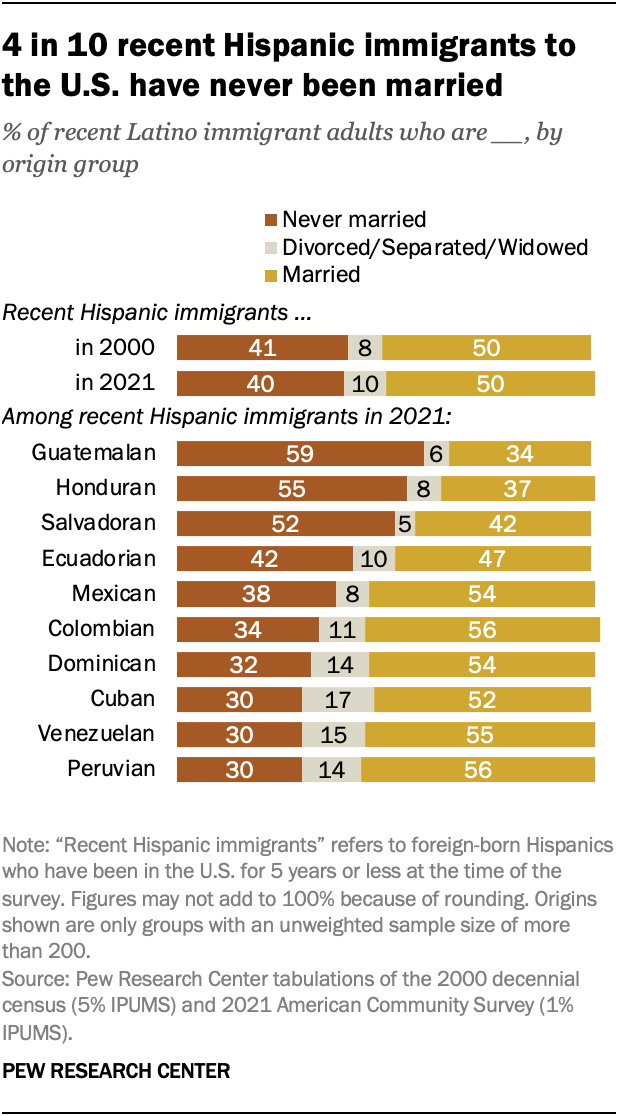
Four-in-ten recent Latino immigrant adults have never been married. Recent Guatemalan, Honduran and Salvadoran immigrant adults are the most likely never to have been married. This is the case for about half or more of recent immigrants from these countries. Notably, these are also the groups with the lowest median ages.
Among recent Mexican immigrants – the largest group in 2021 – a majority (54%) are married, while 38% have never been married.
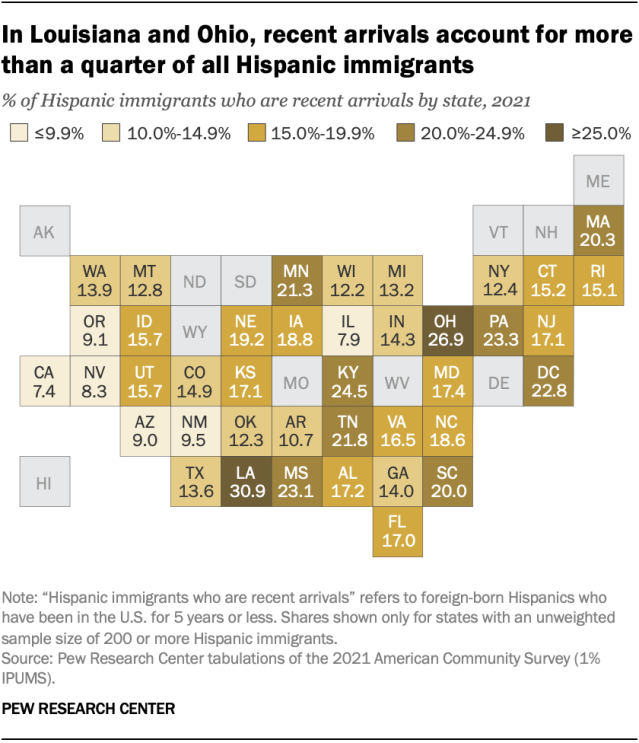
Recent arrivals represent more than 25% of all Hispanic immigrants in some states. This is especially the case in Louisiana, where 30.9% of all Hispanic immigrants have arrived within the last five years as of 2021.
Still, these states have relatively small Hispanic immigrant populations overall. The largest Latino immigrant populations are in California, Texas and Florida. In these states, recent arrivals account for a comparably small share of all Hispanic immigrants.
About a quarter of recent Latino immigrants to the U.S. are proficient in English, but there are notable differences by origin group. About a third of recent Venezuelan (34%), Peruvian (32%) and Colombian immigrants (31%) ages 5 and older are proficient in English.
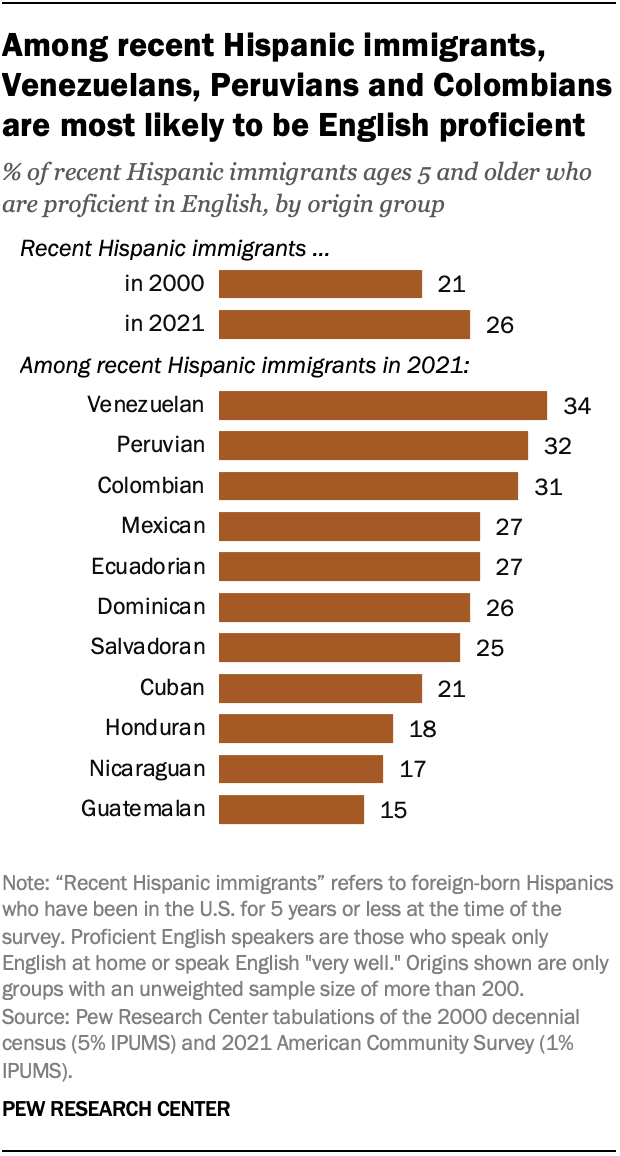
By comparison, recent Guatemalan, Nicaraguan and Honduran immigrants are the least likely to be proficient in English. Fewer than 20% in each group report speaking English at home or speaking it “very well.”
Overall, recent Hispanic immigrants in 2021 were slightly more proficient in English than those in 2000 (26% vs. 21%).
Hispanic immigrants who have been in the U.S. longer than five years are more proficient in English. This is the case for 37% of Hispanic immigrants who have been in the U.S. for five to 10 years and 39% of Hispanic immigrants who have been in the U.S. for 11 or more years.

