

Tattoos have become a more common sight in workplaces around the United States, even making appearances among members of the U.S. House and Senate. Amid this shift, a large majority of U.S. adults say society has become more accepting of people with tattoos in recent decades, according to a new Pew Research Center survey. And 32% of adults have a tattoo themselves, including 22% who have more than one.
Pew Research Center conducted this analysis to find out what percentage of Americans have a tattoo and to understand attitudes toward tattoos among those who have them and those who don’t.
For this analysis, the Center surveyed 8,480 adults from July 10 to July 16, 2023. Everyone who took part in this survey is a member of the Center’s American Trends Panel (ATP), an online survey panel that is recruited through national, random sampling of residential addresses. This way nearly all U.S. adults have a chance of selection. The survey is weighted to be representative of the U.S. adult population by gender, race, ethnicity, partisan affiliation, education and other categories. Read more about the ATP’s methodology.
“Middle income” is defined here as two-thirds to double the median annual family income for panelists on the American Trends Panel. “Lower income” is below that range; “upper income” is above it. See the survey methodology for more details.
Here are the questions used for this analysis, along with responses, and the survey methodology.
Here’s a closer look at Americans and tattoos, based on the new survey:
Which Americans are most likely to have a tattoo?
The likelihood of having a tattoo varies by several demographic factors.
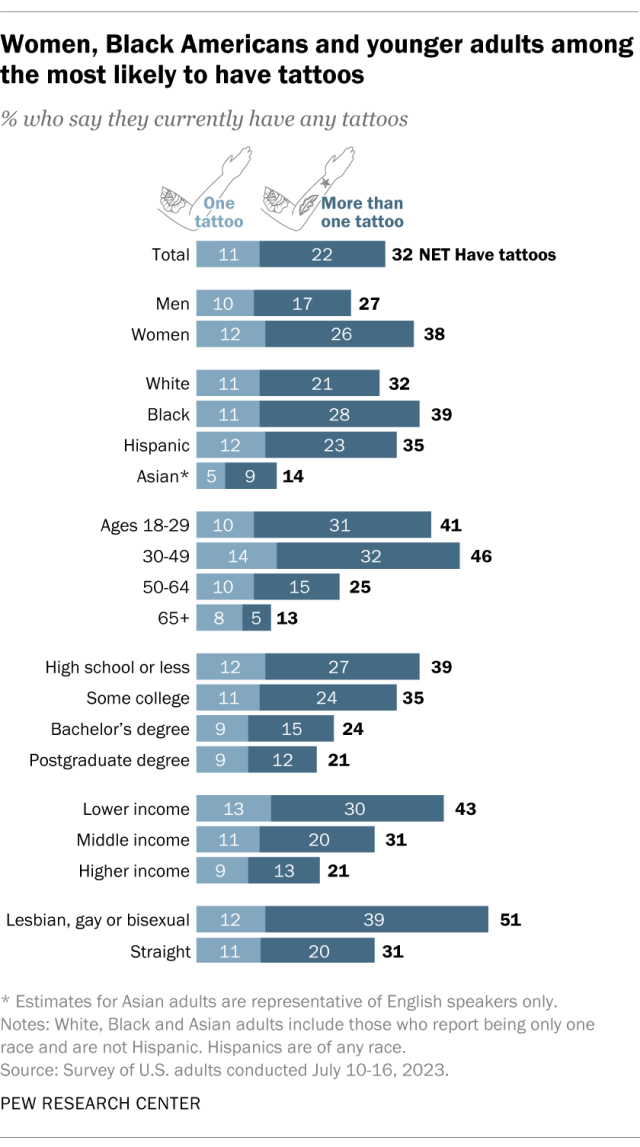
- Gender: 38% of women have at least one tattoo, compared with 27% of men. This includes 56% of women ages 18 to 29 and 53% of women ages 30 to 49.
- Race and ethnicity: 39% of Black Americans have a tattoo, compared with 35% of Hispanic, 32% of White and 14% of Asian Americans.
- Age: Adults under 50 are especially likely to have a tattoo. Some 41% of those under 30 have at least one, as do 46% of those ages 30 to 49. This compares with a quarter of adults ages 50 to 64 and 13% of those 65 and older.
- Education: 37% of those with some college or less education have a tattoo, compared with 24% of those with a bachelor’s degree and 21% of those with a postgraduate degree.
- Income: 43% of lower-income adults have a tattoo, compared with 31% of those in middle-income households and 21% of those in upper-income households.
- Religion: 41% of religiously unaffiliated adults have at least one tattoo, compared with 29% of those who are affiliated with a religion.
- Sexual orientation: Around half of lesbian, gay or bisexual Americans (51%) have at least one tattoo. The share is especially high among women in this group: 68% are tattooed, including 55% who have more than one tattoo. By comparison, 31% of straight Americans have at least one tattoo.
There are no major differences by political party or whether Americans live in an urban, suburban or rural community. A third of Democrats and Democratic-leaning independents have a tattoo, as do 32% of Republicans and Republican leaners. And roughly a third of adults across urban, suburban and rural areas report having a tattoo. There are no differences between veterans and non-veterans, either.
In a 2010 Center survey conducted by phone, 23% of adults said they had a tattoo. But due to changes in survey mode and question wording, the 2010 results are not directly comparable to the results of the new survey.
What are the most common reasons for getting a tattoo?
The new survey also asked tattooed Americans why they have a tattoo.
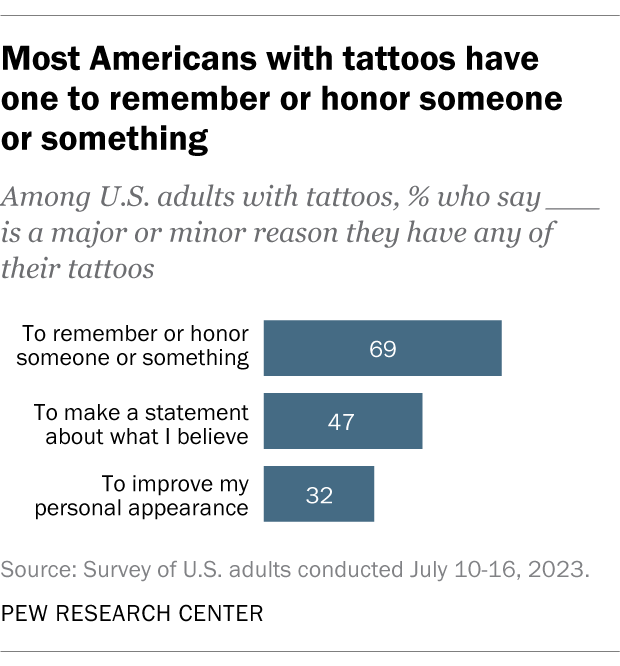
The most commonly cited reason is to honor or remember someone or something: 69% of tattooed adults say this is either a major or minor reason they got any of their tattoos. Just under half (47%) say they got a tattoo to make a statement about what they believe, and 32% say they got at least one to improve their personal appearance.
Here, too, there are some demographic differences. For example, women are 10 percentage points more likely than men to say remembering or honoring someone or something is a reason they have a tattoo (73% vs. 63%).
Some 56% of Black adults say making a statement about what they believe is a reason for their tattoo, compared with 46% of Hispanic adults and 44% of White adults. And 42% of Black adults say improving their personal appearance is a reason, while roughly three-in-ten Hispanic and White adults say the same. (The sample size for tattooed Asian Americans is too small to analyze separately.)
Some tattooed Americans have regrets
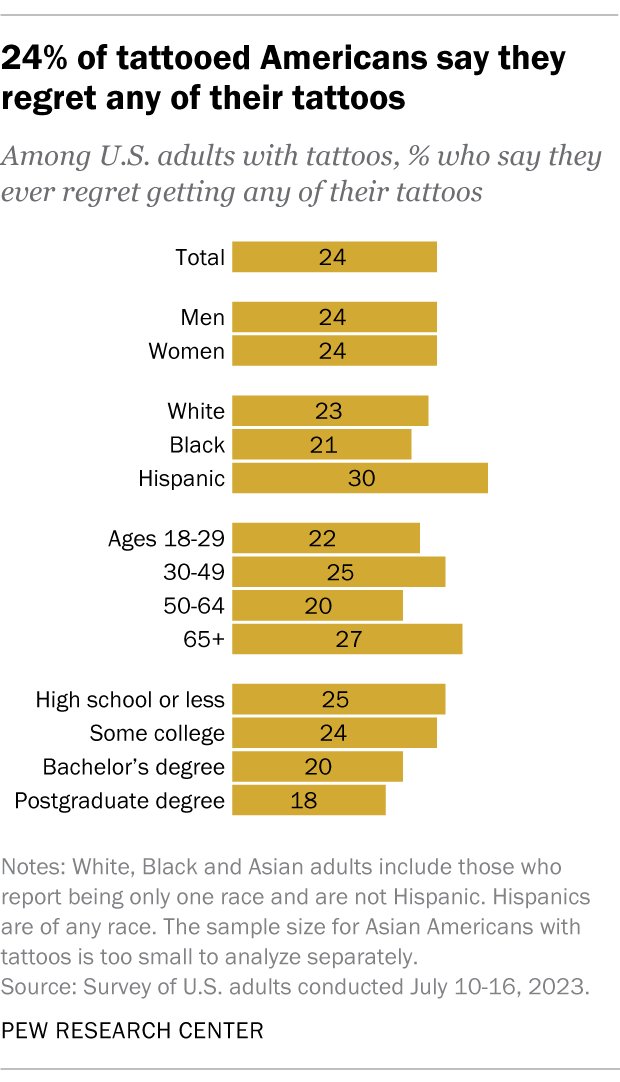
Most tattooed Americans do not regret getting a tattoo. But about a quarter (24%) say they ever regret getting one or more of their tattoos.
Three-in-ten tattooed Hispanic adults report regretting any of their tattoos, compared with 23% of White adults and 21% of Black adults. (The sample size for tattooed Asian Americans is too small to analyze separately.)
A quarter of tattooed adults with some college or less education say they ever regret any of their tattoos. This compares with 19% of those who have a bachelor’s degree or more education.
Which untattooed Americans are most likely to get a tattoo in the future?
The vast majority (85%) of Americans who don’t have a tattoo say they are not too or not at all likely to get one in the future. Another 9% say they are somewhat likely to get one, while 6% say they are extremely or very likely to do so.
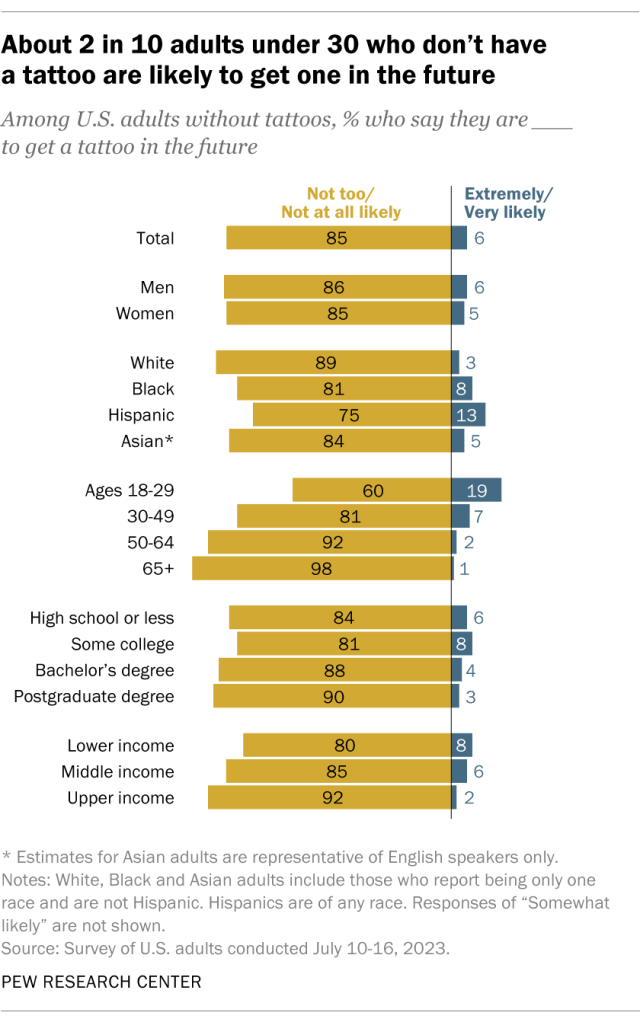
Among untattooed Americans, younger adults are more likely than older adults to say they are extremely or very likely to get a tattoo in the future: 19% of those under 30 say this, compared with 7% of those ages 30 to 49, 2% of those ages 50 to 64 and 1% of those 65 and older.
Some 13% of untattooed Hispanic adults say they are extremely or very likely to get a tattoo, compared with 8% of Black adults, 5% of Asian adults and 3% of White adults.
Adults without tattoos in lower- and middle-income households are also more likely than those in upper-income households to say they’re extremely or very likely to get one: 8% of lower-income adults and 6% of middle-income adults say this, compared with 2% of upper-income adults.
What do Americans without tattoos think about those who have them?
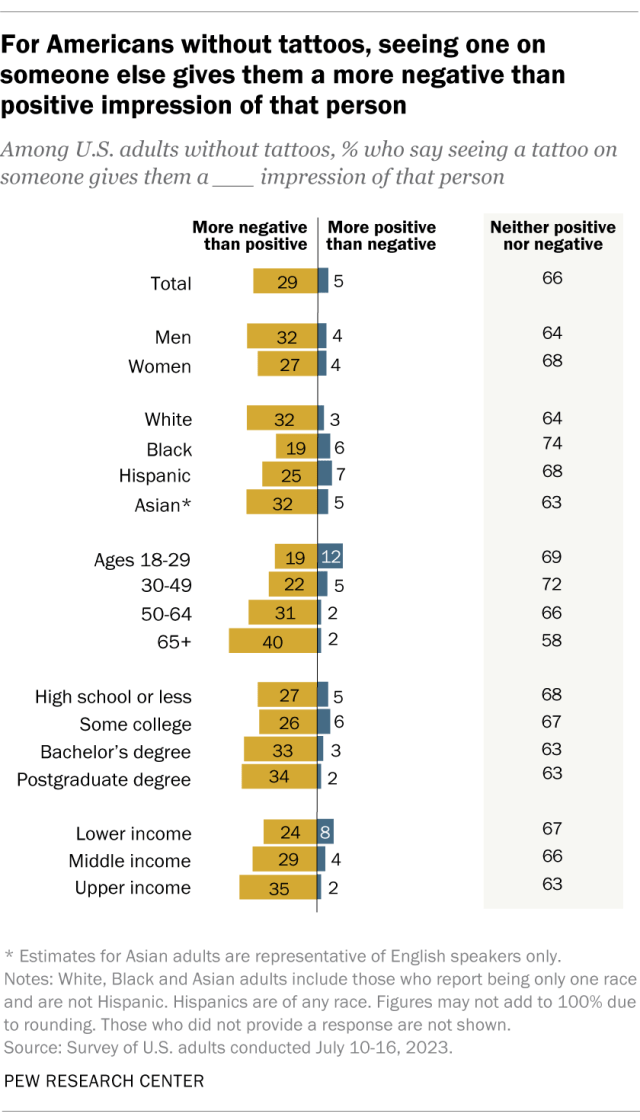
Among Americans who don’t have tattoos themselves, about three-in-ten (29%) say that seeing a tattoo on someone gives them a more negative than positive impression of that person. Just 5% say tattoos leave a more positive than negative impression. But the largest share of untattooed adults (66%) say seeing a tattoo on someone else leaves them with neither a positive nor negative impression of that person.
Men without tattoos are slightly more likely than women without tattoos to have a more negative impression of someone with a tattoo (32% vs. 27%).
There are differences by age, too: Among Americans without tattoos, 40% of those ages 65 and older say seeing someone with a tattoo gives them a more negative than positive impression of that person. Younger adults are less likely to hold this view.
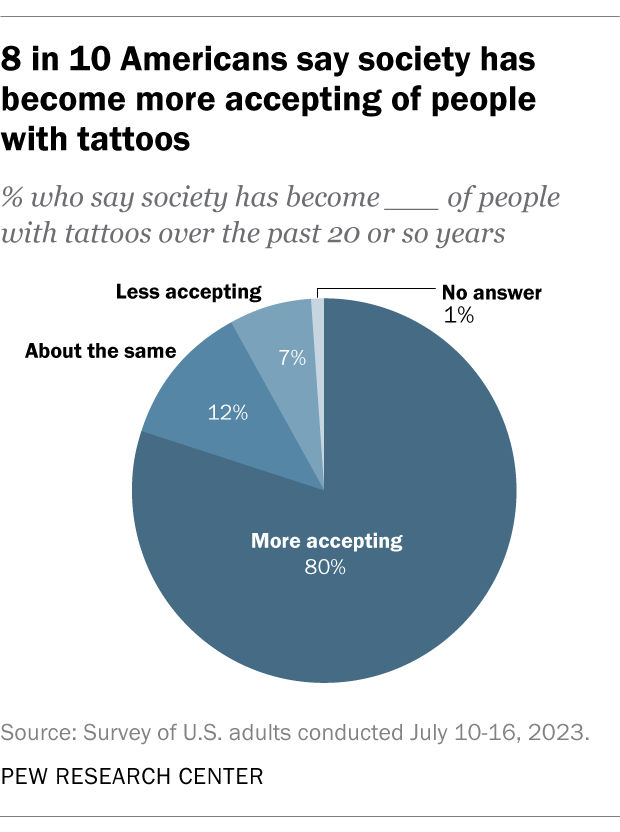
More broadly, Americans overall – including those with and without tattoos – believe society has become more accepting of people with tattoos over the past 20 years or so. Eight-in-ten U.S. adults say this, while far fewer (7%) say society has become less accepting of tattooed people. Another 12% say societal acceptance of people with tattoos has stayed about the same over the past two decades.
Note: Here are the questions used for this analysis, along with responses, and the survey methodology. This post was updated on Aug. 16, 2023, to indicate that there are no statistically significant differences by veteran status on having a tattoo.
