
Since 2020, more than three-quarters of U.S. adults have expressed an unfavorable opinion of China, according to Pew Research Center surveys. Some 79% of adults expressed an unfavorable opinion of China in 2020, 76% did so in 2021 and 82% did so in 2022.
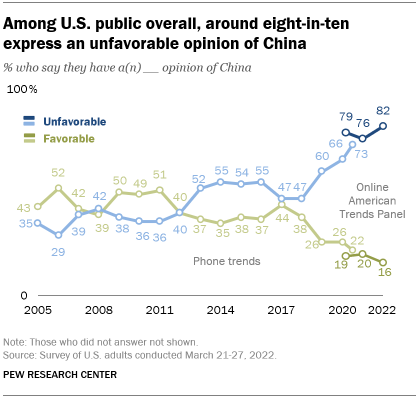
While the overall share of adults with an unfavorable view of China remained relatively steady during this period, there were some notable shifts beneath the surface, according to a new analysis of the data.
When looking at individual Americans, roughly a quarter of U.S. adults (26%) became more negative toward China between 2020 and 2022. Around one-in-five (17%) became more positive toward it, while 53% did not change their views in one direction or the other, according to the analysis. The study was done using Pew Research Center’s American Trends Panel, a nationally representative group of U.S. adults who regularly take our surveys, allowing researchers to examine attitudinal changes among the same people over time.
How we did this
This Pew Research Center analysis examines changes in individual Americans’ attitudes toward China between 2020 and 2022. It is based on surveys conducted in both years using the Center’s nationally representative American Trends Panel. The analysis is restricted to the 1,897 U.S. adults who took both a March 2020 survey and a March 2022 survey that asked about views of China. Because the same set of individuals were interviewed in each survey, changes in opinion can be tracked over time.
The analysis is based on both crosstabs and fixed effects regression analysis. Fixed effects regression is particularly powerful because it looks at changes over time in individual survey takers’ attitudes. Fixed effects regression automatically controls for all variables that are constant over time for each individual, even if these variables aren’t measured. In this analysis, we also controlled for several other attitudes that were likely to have changed over time that we expected to be related to views of China.
Here are the questions used in both surveys, as well as the 2020 methodology and the 2022 methodology.
When asking the public for its attitudes about China, the Center gave survey takers four main answer options in its 2020 and 2022 surveys. Respondents could indicate they have a very favorable view of China, a somewhat favorable view, a somewhat unfavorable view or a very unfavorable view. The chart below, known as a Sankey diagram, shows how opinions about China changed – or didn’t change – among U.S. adults who answered this question in both the 2020 survey and the 2022 survey:
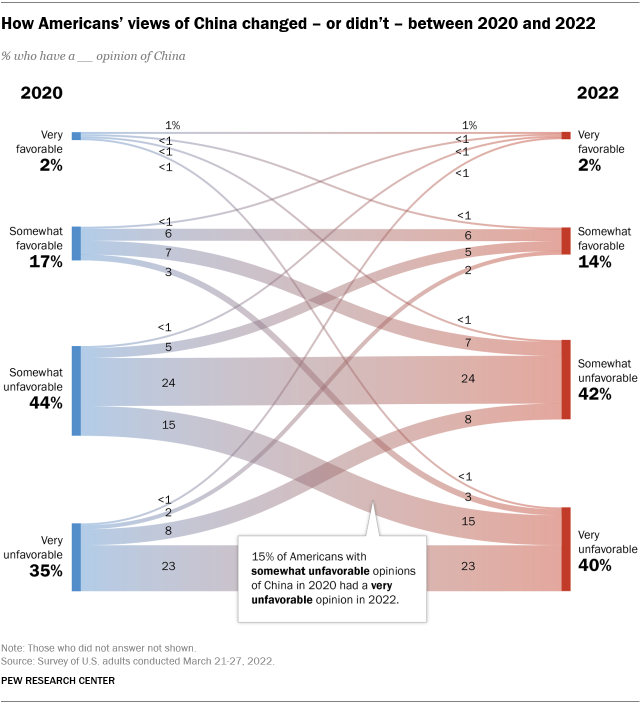
Opinion changes are evident in both directions. The most common change in views was in the negative direction, as shown by the descending lines in the chart: 15% of adults moved from holding a somewhat unfavorable view of China in 2020 to a very unfavorable view in 2022. Another 7% moved from somewhat favorable toward China to somewhat unfavorable, while 3% moved from somewhat favorable to very unfavorable.
The ascending lines show the percentage of Americans who became more positive toward China between 2020 and 2022. For example, 8% of adults who had a very unfavorable view in 2020 changed their answer to somewhat unfavorable in 2022. And 5% of those with a somewhat unfavorable view of China in 2020 said in 2022 that they had a somewhat favorable view.
The broad horizontal lines in the chart show the Americans who didn’t change their opinions between 2020 and 2022. For example, 24% of adults had a somewhat unfavorable view of China in 2020 and in 2022. And nearly the same share (23%) had a very unfavorable view in both years.
Overall, seven-in-ten who had an unfavorable view of China in 2020 – either very unfavorable or somewhat unfavorable – continued to have a negative view of the country in 2022. A much smaller share (8%) of those who had a favorable view of the country in 2020 – either very favorable or somewhat favorable – continued to feel that way two years later.
Who changed their views on China?
When it comes to who changed their minds and in which direction, a few patterns are evident.
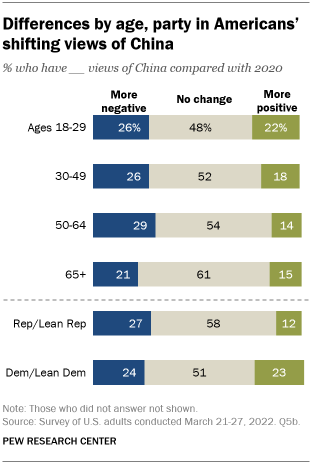
Democrats and independents who lean toward the Democratic Party were about equally likely to become more negative (24%) and more positive (23%) toward China between 2020 and 2022. Republicans and GOP leaners, on the other hand, were about twice as likely to have turned more negative (27%) than positive (12%).
Older adults were the least likely to have changed their mind one way or the other. Whereas 61% of those ages 65 and older held the same opinion about China in both 2020 and 2022, fewer did so in younger age groups: 54% of those ages 50 to 64, 52% of those 30 to 49 and 48% of those under 30.
Several other factors relate to whether people changed their views toward China – and in what direction – between 2020 and 2022. For example, statistical modeling indicates that U.S. adults who changed their minds about China’s policies on human rights between 2020 and 2022 – describing them as a greater concern – were also more likely to turn more unfavorable toward China during this period. The same is true about perceptions of China’s power and influence as a threat to the United States: Adults who changed their views about the threat posed by Chinese power and influence also tended to change their broader attitudes about China between 2020 and 2022.
Note: Here are the questions used in both surveys, as well as the 2020 methodology and the 2022 methodology.
