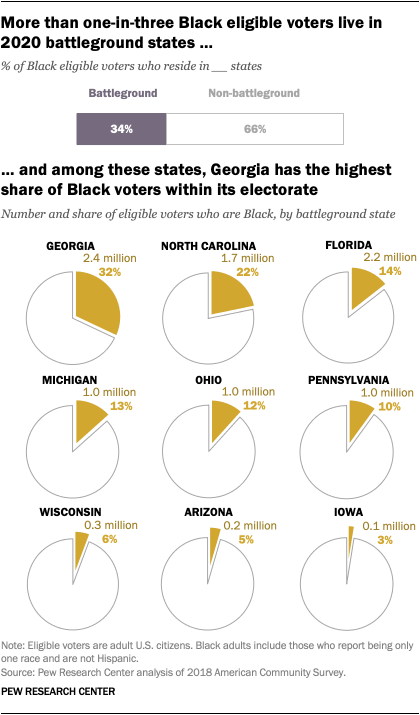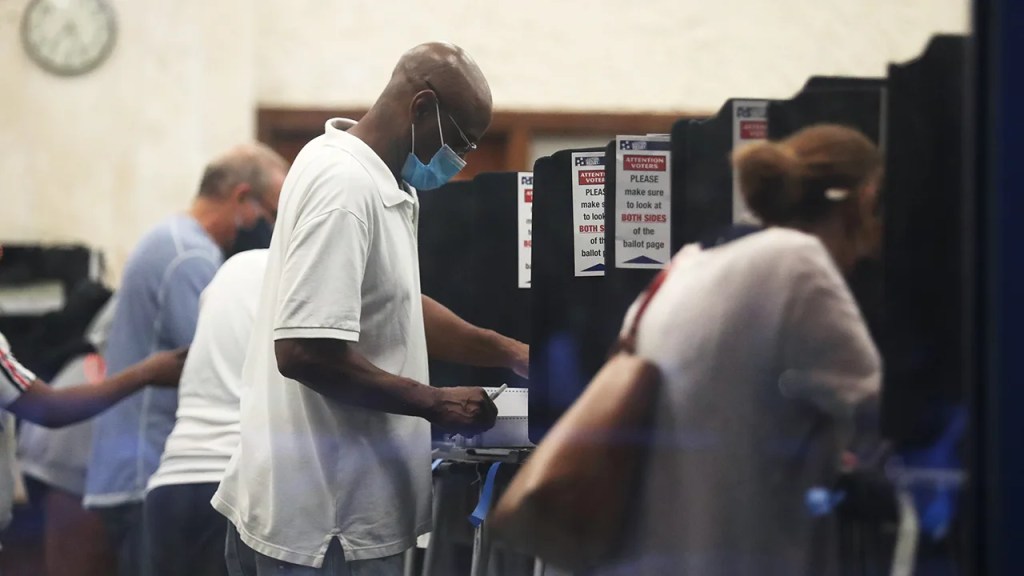
The number of Black Americans eligible to vote for president has reached a record 30 million in 2020, with more than one-third living in nine of the nation’s most competitive states – Arizona, Florida, Georgia, Iowa, Michigan, North Carolina, Ohio, Pennsylvania and Wisconsin – a higher share than the 29% of all U.S. eligible voters who live in these states. Nationwide, Black eligible voters now make up 12.5% of the U.S. electorate, up from 11.5% in 2000.
For many years, Black voters were the largest non-White racial or ethnic segment of the country’s electorate, but for the first time in a presidential election they will be outnumbered by Hispanic eligible voters, at 32 million.
For this year’s upcoming presidential election, a recent Pew Research Center survey found that 63% of Black registered voters are extremely motivated to vote. Furthermore, among those who support Joe Biden, over a third (35%) said that they plan on casting or have already cast their vote by absentee or mail-in ballot.
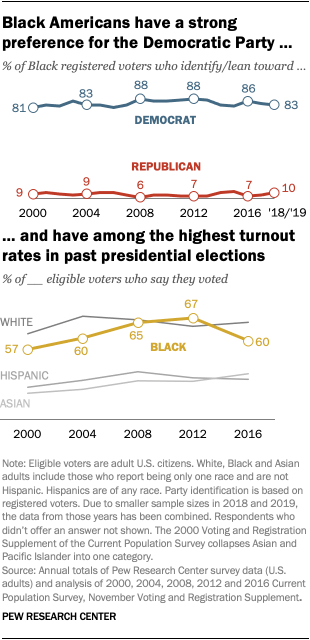
The Democratic Party has maintained a strong advantage among Black voters, according to over two decades of Center polling. Black voters have also recorded comparatively high turnout rates relative to other major racial and ethnic groups in recent elections – their levels closely matching White voter turnout rates in 2008 and 2012.
Yet Black eligible voters are by no means monolithic in their views or demographics. In the six states with competitive races for president, Black eligible voters have varied levels of educational attainment, income and immigrant populations. Here are key facts about Black eligible voters living in this year’s battleground states.
For this report, we analyzed the detailed demographics of Black Americans who are eligible to vote in the 2020 presidential election. The term “eligible voters” refer to persons ages 18 and older who are U.S. citizens. The analysis is primarily based on data from the U.S. Census Bureau’s 2018 American Community Survey (the most recent year available) provided through Integrated Public Use Microdata Series (IPUMS) from the University of Minnesota.
Visit this page to read about how Pew Research Center determined its categorization of battleground states for the 2020 presidential elections.
Black eligible voters make up varying shares of the electorate in the battleground states. In Georgia, the state’s 2.4 million Black eligible voters make up 32% of the electorate, the highest share among these nine states. Meanwhile, in Arizona – a new battleground state that every Republican presidential candidate has won since 1952 (except in 1996) – Black Americans account for less than 5% of the electorate. The share is even lower in Iowa, where Black eligible voters account for just 3% of the state’s overall electorate.
From 2000 to 2018, the share of Black eligible voters increased by 5 percentage points in Georgia, the largest percentage point increase out of any battleground state. In Arizona, Florida, North Carolina, Iowa, Ohio, Pennsylvania and Wisconsin, the population’s share rose by 1 to 2 points. And in Michigan, the population’s share of the electorate was unchanged during this time. (2018 is the most recent year for which state level data is available.)
Trump won all nine states in 2016, though he did so by a razor-thin margin in three of them. He carried Michigan, Pennsylvania and Wisconsin – states where together nearly 14 million people cast a ballot – by less than 78,000 votes combined.
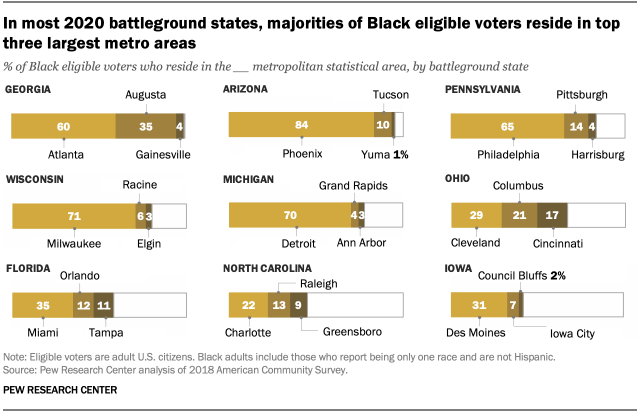
Across most battleground states, a majority of Black eligible voters live in the top three largest metropolitan areas in the state. In Georgia, Arizona, Pennsylvania, Michigan and Wisconsin, a large majority of Black eligible voters live in each state’s largest metro area. In Ohio, Florida, North Carolina and Iowa, Black eligible voters are more evenly distributed across several metro areas.
Four-in-ten Black eligible voters are Millennials or GenZers. In all nine battleground states, Millennials (those ages 24 to 39 in 2020) make up a slight plurality – 29% to 40% – of all Black eligible voters. Gen Z eligible voters, the oldest of whom turn 23 this year, make up 15% or less of each state’s Black electorate. Gen Xers and Baby Boomers each make up around one-fifth to one-quarter of the states’ Black voting public, and those who are members of the Silent and Greatest generations comprise less than a tenth of Black eligible voters.
Compared with Black eligible voters, the nation’s overall electorate is comprised of slightly higher shares of those who belong to the Baby Boomer, Silent and Greatest generations and marginally lower shares of Gen Xers, Millennials and GenZers.
This slight generational difference is reflected in the median age of each respective group. The median age of the Black electorate is 44 in 2018, while the nation’s overall is 48.
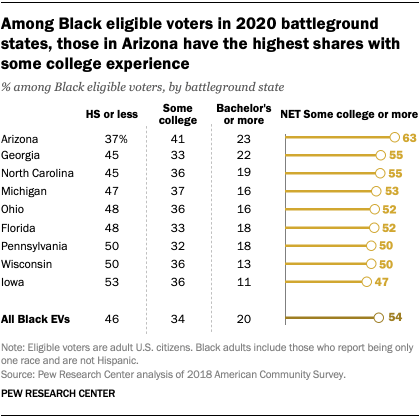
About half of Black eligible voters in the nine battleground states attended at least some college, with Arizona (63%) having the highest share. Just over half of Black eligible voters in the battleground states of Georgia (55%), North Carolina (55%), Michigan (53%), Ohio (52%) and Florida (52%) attended college, while the shares are slightly lower among those in Pennsylvania (50%), Wisconsin (50%) and Iowa (47%).
Nationwide, more than half of Black Americans (54%) who are eligible to vote have at least some college education (this includes those with associate degrees), compared with 62% of U.S. eligible voters overall.
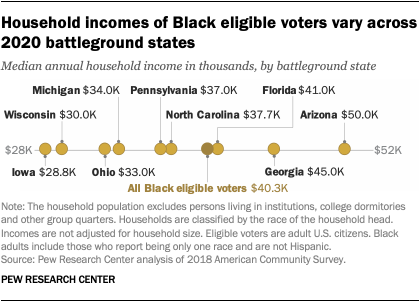
The median incomes of Black households differ significantly among battleground states. Those residing in Arizona have the highest income levels within the six battleground states, at $50,000, followed by those in Georgia at $45,000 and Florida at $41,000. In North Carolina and Pennsylvania, Black eligible voters had median household incomes of $37,700 and $37,000, respectively. Those in Iowa ($28,800) and Wisconsin ($30,000) recorded the lowest household income levels among the nine states.
Overall, the median household income of the nation’s Black electorate is about two-thirds that of that country’s entire eligible voter population – $40,300 compared with $62,000.
While median incomes can vary widely among states, income inequality also exists among Black Americans overall. Black Americans near the top of their income distribution (the 90th percentile) had incomes 9.8 times greater than the incomes of Black Americans near the bottom of their income distribution (the 10th percentile), a gap that is exceeded only by Asian Americans.
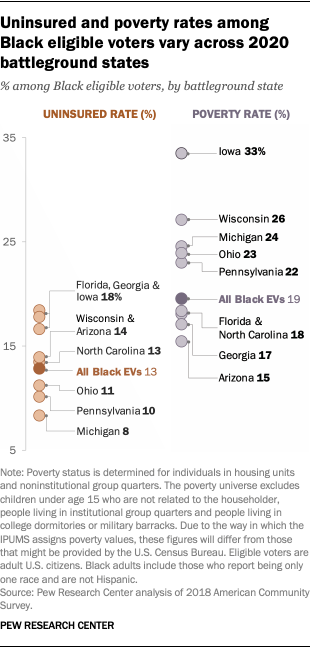
Poverty and health insurance coverage among Black eligible voters vary in swing states. Florida, Georgia and Iowa had the highest share of Black eligible voters without health insurance (18%), while Michigan had the lowest share (8%). In six battleground states, the uninsured rate exceeded the national Black eligible voter average (13%). Meanwhile, the Black electorate in all nine states had uninsured rates that equaled or exceeded that of the U.S. electorate overall (8%).
In terms of poverty rates, Black eligible voters in Iowa reported the highest shares of those living in poverty among battleground states at 33%. This is followed by Wisconsin (26%), Michigan (24%), Ohio (23%) and Pennsylvania (22%). All of these exceed the shares of those living in poverty among all Black eligible voters (19%) and U.S. eligible voters overall (11%).
The uninsured and poverty rates of Black eligible voters reflect national racial and ethnic disparities that have been exacerbated by the coronavirus outbreak. In nearly every state, Black Americans have accounted for a disproportionately higher share of COVID-19 deaths, and also have experienced widespread economic hardships.
A Pew Research Center survey in September found that since the U.S. coronavirus outbreak started in February, 43% of Black Americans said they had trouble paying their bills, while 33% said they have gotten food from a food bank – higher shares than the 25% and 16% of the general public who said the same, respectively. Another survey conducted in the same month found that Black adults are more hesitant to trust medical scientists and to get vaccinated for COVID-19 if a vaccine was available.
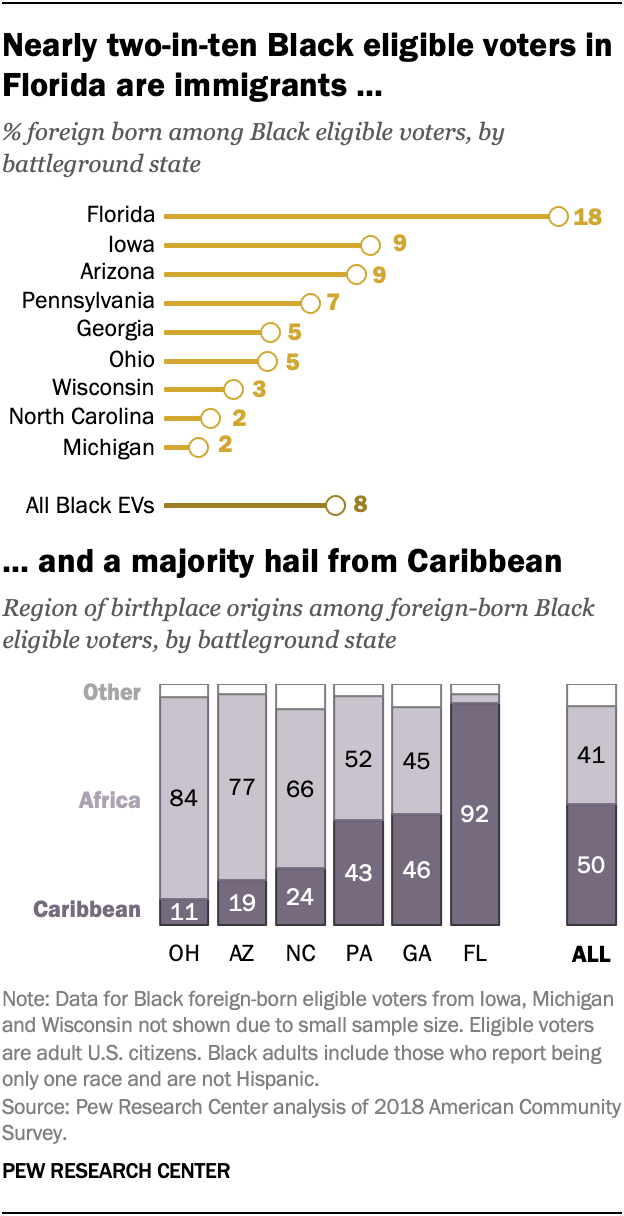
Naturalized immigrants account for nearly one-in-five Black eligible voters in Florida, by far the highest share among battleground states. By contrast, immigrants make up less than 5% of the Black electorate in Ohio, Wisconsin, North Carolina and Michigan.
Immigrants have been an important driver in the growth of the country’s Black eligible voter population. Between 2000 and 2018, the number of immigrants in the Black electorate almost tripled from 800,000 to 2.3 million, and their shares doubled from 4% in 2000 to 8% in 2018, according to Pew Research Center analysis of U.S. Census Bureau data.
The top two regions of origin for this electorate are the Caribbean and Africa, with these regions accounting for 50% and 41% of Black immigrant eligible voters, respectively. This reflects trends among the overall Black American foreign-born population.
The top regions of origin can differ greatly between battleground states. In Florida, the vast majority (92%) of its Black immigrant voting public hails from Caribbean nations such as Haiti and Jamaica. In Ohio, by contrast, 84% of its immigrant Black electorate was born in African countries such as Ethiopia and Somalia.
