Survey data shows that religious “nones” are, on average, less civically and politically engaged than people who identify with a religion. But the differences are often modest and tend to be concentrated among the subset of “nones” who describe their religion as “nothing in particular.”
Indeed, by several measures, atheists and agnostics are about as civically and politically engaged as U.S. adults who identify with a religion. It’s often just the “nothing in particular” group that stands out for having relatively low levels of civic behavior, such as voting and volunteering.
Why is this important? Traditionally, people who are involved with U.S. religious congregations have tended to be involved with all sorts of other organizations and activities – from PTAs and community groups to voting in elections.
This has led some observers to wonder: Could the rise of religious “nones” in the United States effectively diminish Americans’ participation in civic and community life? Put another way, could the decline of religion leave the U.S. with fewer volunteers, community activists and civic leaders?3
Others have contended that the causal arrow may point in the other direction – that the decline of religion may itself be a symptom of a broader American disengagement from institutions and organizations. According to this line of reasoning, the decline of religion is just one manifestation of disaffection from (and loss of trust in) fellow citizens and institutions of all kinds.4
It’s beyond the scope of this report to definitively answer these big questions about the impact of the decline of organized religion on U.S. civic life, or to sort out how much of religion’s decline is explained by a broader rejection of institutions and organizations. But we have collected lots of data in recent years on the connections between religion and civic engagement, and this chapter briefly reviews it.
On many measures, religious ‘nones’ are less involved in civic life
Overall, 17% of religious “nones” say they volunteered for an organization or association in the past year – 10 percentage points lower than the share of religiously affiliated people who say this.
And religious “nones” are 12 points less likely than religiously affiliated citizens to have turned out to vote in the 2022 midterm elections (39% vs. 51%). (These estimates are based on an analysis that uses publicly available official state records to verify voter turnout.)
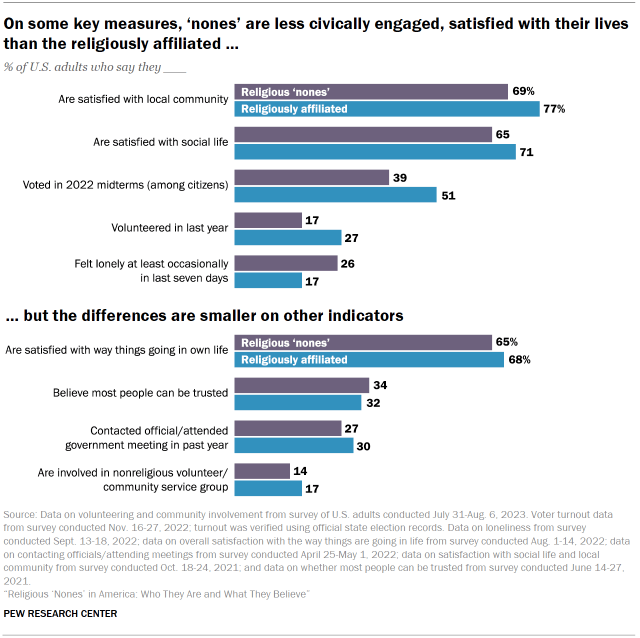
Compared with religiously affiliated people, religious “nones” are also somewhat less satisfied with various aspects of their lives, including their local community and their social lives. And in a September 2022 survey, religious “nones” were more likely than other U.S. adults to say they’d felt lonely in the preceding week, and less likely to say they’d felt hopeful.
But differences between ‘nones’ and the religiously affiliated are often modest
For example, religious “nones” are only slightly less likely than religiously affiliated people to say they are currently involved in a nonreligious volunteer or community service group, as well as to say that they’ve recently contacted an elected official or attended a government meeting – all of which are standard measures of civic engagement. And the percentage of religious “nones” who say most people can be trusted is virtually identical to the percentage of religiously affiliated people who take that position – a classic measure of social trust.
And although “nones” are somewhat less satisfied than religiously affiliated people, most “nones” say they are satisfied with their family lives, social lives and local communities. Most “nones” do not say they are lonely.
Among ‘nones,’ those describing their religion as ‘nothing in particular’ (not atheists and agnostics) often tend to be the least civically engaged
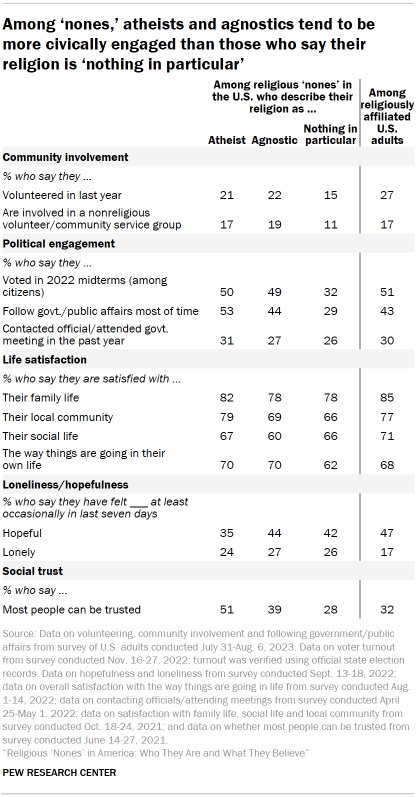
In terms of political engagement, for example, atheists and agnostics are about as likely as religiously affiliated Americans to have voted in the 2022 midterm elections.
Atheists are actually more likely than religiously affiliated Americans to say they follow government and public affairs closely. Furthermore, atheists and agnostics are more likely than religiously affiliated people to say most people can be trusted.
U.S. adults who say their religion is “nothing in particular,” however, are less likely than atheists, agnostics and people who identify with a religion to say they have volunteered in the past year, to have voted in the 2022 midterms, and to say they follow government or public affairs all or most of the time.
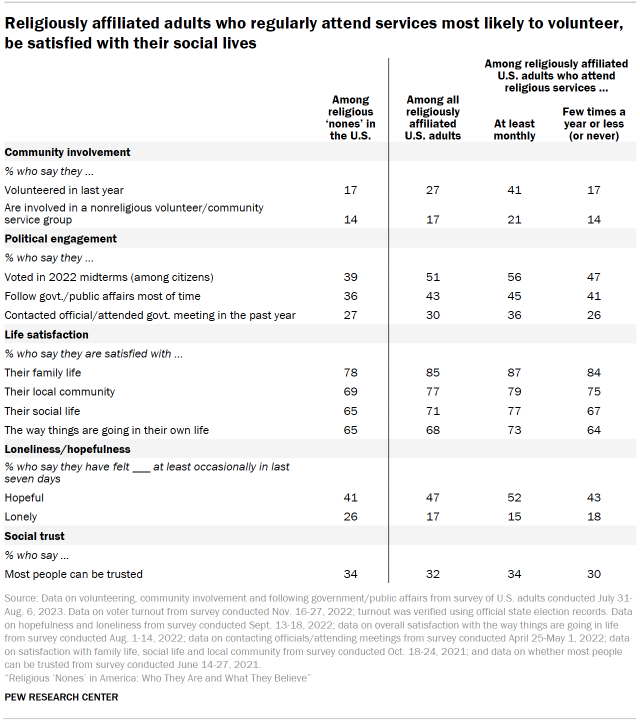
On some measures, there is little difference between ‘nones’ and religiously affiliated people who don’t regularly attend religious services
Overall, 41% of religiously affiliated people say they go to services at least once or twice a month. Very few “nones” attend religious services.
On several key indicators of civic engagement, religiously affiliated people who regularly attend services stand out for their high levels of involvement. For example, they are far more likely to have volunteered in the last year than either “nones” or religiously affiliated people who don’t attend religious services.
Meanwhile, “nones” are about as likely as religiously affiliated people who don’t attend religious services to say they volunteered in the past year or that they are involved in a nonreligious community service group.
“Nones” are also about as likely as religiously affiliated people who don’t attend religious services to express satisfaction with their social lives and to have felt hopeful lately.
Voter turnout among the ‘nones’
In the 2022 midterm election, atheists and agnostics turned out to vote at higher levels than “nones” who describe their religion as “nothing in particular,” and at similar levels to U.S. adults who identify with a religion.
Older “nones” voted at higher levels than younger ones, and higher shares of White “nones” than Black or Hispanic “nones” turned out to vote. In addition, “nones” with more education turned out at a higher rate than those “nones” with less education. These differences within the religiously unaffiliated population mirror broader patterns in the U.S. public as a whole.
Meanwhile, “nones” who are men turned out to vote at a higher clip than “nones” who are women. This partly reflects the fact that men who are religiously unaffiliated are more likely than women to identify as atheist or agnostic, and atheists and agnostics turn out to vote at higher rates than “nones” who describe their religion as “nothing in particular.” (Among “nones” in the July 31-Aug. 6, 2023, survey who are men, 22% are atheists, 24% are agnostics and 54% describe their religion as “nothing in particular.” Among “nones” who are women, 12% are atheists, 15% are agnostics and 73% are “nothing in particular.”)
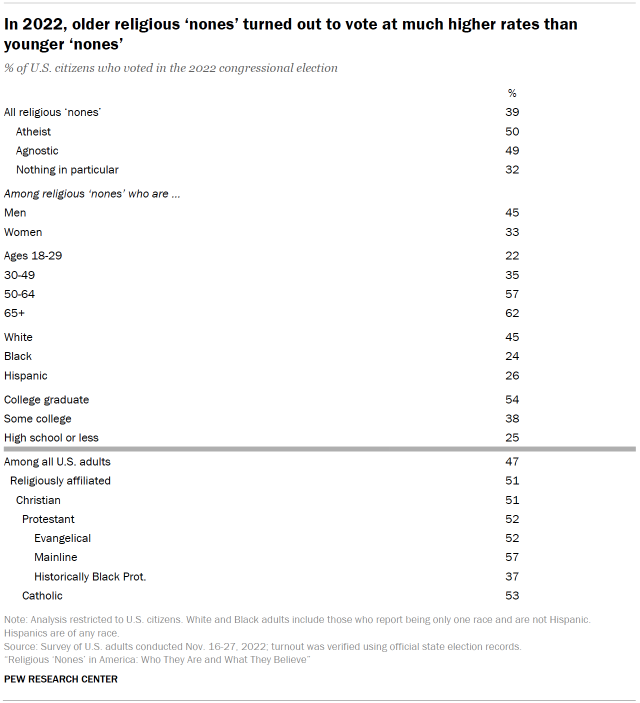
But the data also shows that among those whose religion is “nothing in particular,” men turned out to vote at a higher clip than women (40% vs. 27%). Among atheists and agnostics, roughly equal shares of men and women turned out to vote in 2022.
Volunteerism among ‘nones’
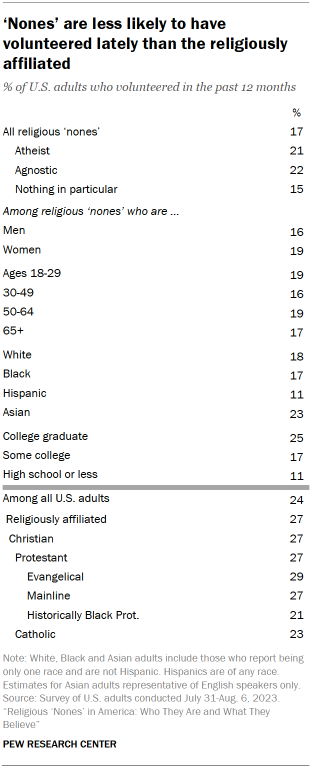
Religious “nones” are somewhat less likely than U.S. adults who are religiously affiliated to have volunteered in the last year. That said, atheists and agnostics are slightly more likely than people who report their religion is “nothing in particular” to have volunteered lately.
White and Asian “nones” are slightly more likely than Hispanic “nones” to have volunteered in the last year.
And “nones” who graduated from college are more likely to have volunteered in the last year than are “nones” with less education.
Following government and public affairs
Among “nones,” 36% say they follow “what’s going on in government and public affairs” most of the time, while 34% follow public affairs some of the time. Another 29% say they do so only now and then or hardly at all.
Atheists and agnostics are more likely than U.S. adults reporting their religion as “nothing in particular” to follow government and public affairs most of the time.
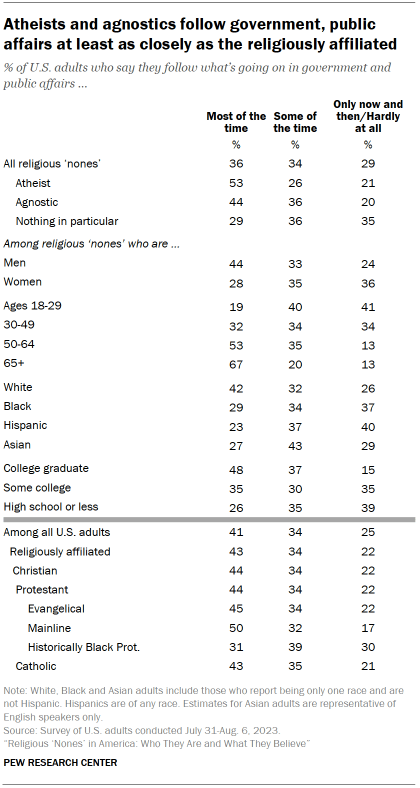
Some 44% of religiously unaffiliated men report they follow public affairs most of the time, compared with 28% of religiously unaffiliated women who say they do this.
Older “nones” are much more likely than younger “nones” to follow public affairs. And “nones” with college degrees are more likely than those with less education to keep up with government and public affairs.
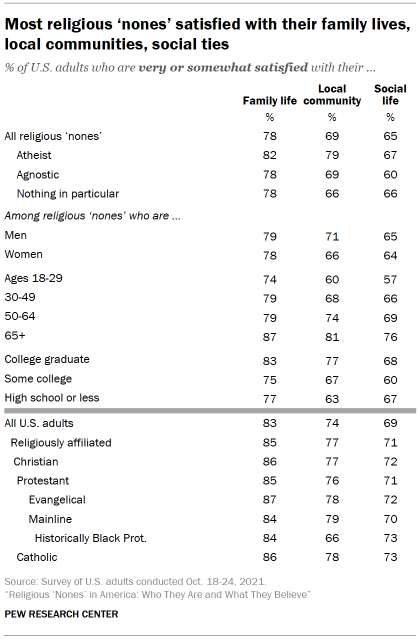
Satisfaction with family life, local communities, social life
About eight-in-ten religious “nones” are very or somewhat satisfied with their family lives. Around seven-in-ten are satisfied with the quality of life in their local community. And 65% are satisfied with their social lives.
While the religiously unaffiliated are somewhat less likely than Americans who identify with a religion to be satisfied in these ways, majorities in both groups report satisfaction on each of these measures.
Older “nones” tend to be more satisfied with their family lives, communities and social lives than younger “nones.”
“Nones” who have graduated from college express higher levels of satisfaction with their family lives and their local communities compared with “nones” who have not completed college.
Return to the report’s Overview.
Find answers to other questions:
- Who are the ‘nones’? How are they defined? (Chapter 1)
- Why are ‘nones’ nonreligious? (Chapter 2)
- Are all ‘nones’ nonbelievers? (Chapter 4)
- Are ‘nones’ spiritual instead of religious? (Chapter 5)
- Are ‘nones’ hostile toward religion? (Chapter 6)
- How do ‘nones’ view science? (Chapter 7)
- How do ‘nones’ think about morality? (Chapter 8)