This section describes the sources and variables used for the analyses in this report. First, it explains the known limitations of the data measuring sex ratios at birth in India. Next, it outlines how each of the key variables – including son preference, ultrasound use and sex selection – was derived. Finally, the methodology for estimating the number of “missing” female births is described in detail.
Data underlying this study came primarily from the India censuses (2001, 2011) and four waves of the National Family Health Survey (NFHS) conducted from 1998-2021. The Indian censuses provide estimates for sex ratio at birth by religion and state. The NFHS provides data on son preference and ultrasound use; it has also provided data on sex ratios at birth since the last 2011 Indian census. Pew Research Center chose these datasets because they are well-established, publicly-available sources of data that include measures relevant for this report. In 2001, the census began asking about the sex of children born in the last year. Estimates of sex ratios prior to 2001 are based on five-year estimates made by the United Nations using India’s birth register sample data.
The NFHS, which has been conducted since 1992-93, is a nationally representative cross-sectional household survey. It provides extensive information on fertility desire and pregnancy/birth histories among women of reproductive age (15 to 49). Its large sample size – around 640,000 (6.4 lakh) households and 720,000 (7.2 lakh) individual women ages 15 to 49 in the most recent wave (2019-21) – also allows for investigating sex-ratio-at-birth trends over time and differences among religious groups. One of the recognized strengths of the NFHS is its high item response rate. The rates are particularly high across demographic measures such as religion, caste, place of residence, wealth and education. For example, data is available to classify the religion, place of residence, and wealth level of all respondents. Only a small share of respondents (<1%) are missing information on caste and education in the latest round of the NFHS.55
The fieldwork for the 2019-21 NFHS was split in two phases due to the coronavirus pandemic. Phase I of the survey, covering 22 states and union territories, was completed before the pandemic lockdown that began in March 2020. Phase II, surveying the remaining 14 states and union territories, had fieldwork suspended due to the pandemic; it resumed in November 2020, and was completed by April 2021. Interviews conducted prior to the lockdown account for about 70% of the sample.
Sex ratio at birth
In this report, we rely on data on births in the year preceding the Indian census – approximately 20 million (2.0 crore) births – to compute the sex ratio at birth in 2001 and 2011.56 Because of its comprehensive effort to count every household, the census is the best available source to discern patterns in the sex ratio at birth across religious groups in India, though there are some known issues with the reliability of census data on religious identification in India.57
Because the census is available only every 10 years – and the 2021 census was delayed by the coronavirus pandemic – we also draw on data from the National Family Health Survey, specifically births in the five years preceding each wave of the NFHS, to understand trends in the sex ratio at birth since 2001 and variation across religious groups.
There are several other data sources that can be used to infer India’s sex ratio at birth. The Civil Registration System (CRS) produces sex ratio estimates among registered births, but the CRS estimates suffer from known biases: Parents are more likely to register male than female births. The level of India’s birth registration has been improving over time (from 56% in 2000 to 93% in 2019), making the CRS an unfit source to discern clear trends over time in the sex ratio at birth.
The Sample Registration System (SRS) is another source of vital statistics in India. It is based on continuous enumeration of births and deaths in fairly representative sampling units across India. Some scholars point out that the SRS tends to overestimate the skew in India’s sex ratio at birth because the survey relies on local enumerators or household heads – who may underreport female births and/or misreport birthdates – for birth information.58
Retired professor Purushottam M. Kulkarni, formerly at Jawaharlal Nehru University, has carefully reviewed estimates of India’s sex ratio at birth from various sources and finds that the NFHS produces sex ratio estimates that are comparable to the census.59 Dr. Kulkarni derived an indirect estimate of sex ratio at birth from the census by applying the reverse survival method to child sex ratio (a technique to numerically “resurrect” those no longer present among the population using survivorship probabilities), and he showed that the NFHS results are closer than the SRS to the census. For instance, the NFHS shows the average birth ratio between 1994 and 2000 is 108 boys per 100 girls, close to the indirect estimate from the 2001 census (107), while the SRS ratio (112) is more male-biased. In other words, Dr. Kulkarni’s research indicates that India’s birth ratios are not as male-biased as the SRS suggests, and that the NFHS produces more reliable estimates than the SRS of sex ratios at birth.
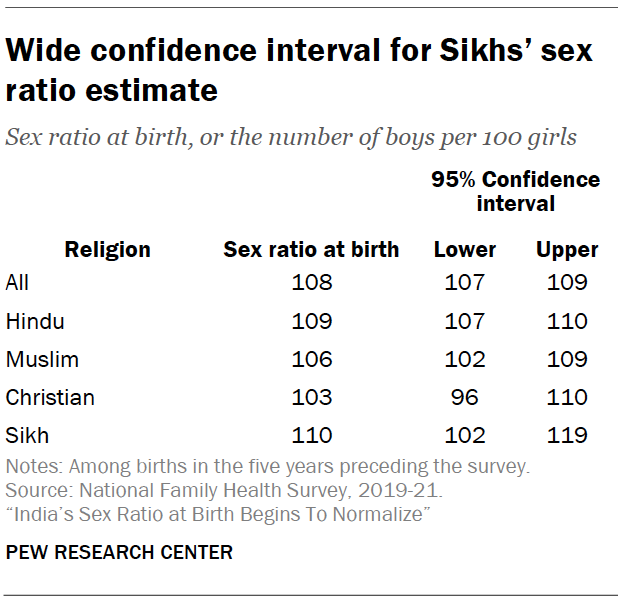
While the sex ratio at birth estimates from the NFHS are generally considered reliable, they come with confidence intervals, just like other survey estimates. As precise estimates require a large sample size, the 95% confidence interval is particularly wide for small religious groups. For instance, the estimated sex ratio at birth for Muslim women (based on over 33,000 or 0.3 lakh births in the past five years preceding the survey) is 106 boys per 100 girls, with the confidence interval between 102 and 109 boys per 100 girls. Due to its wide confidence intervals, the Hindu-Muslim difference in sex ratios (109 vs. 103) is only marginally significant at the 90% confidence level. To ensure relatively precise sex ratio at birth estimates, we limit the analysis to India’s four major religious groups: Hindus, Muslims, Christians and Sikhs.
In addition, as mentioned above, the fieldwork for the recent 2019-21 NFHS was conducted in two phases: before and during the pandemic. Some scholars have expressed concerns about inferring trends in health and economic measures using the 2019-21 data as it is unclear whether some changes might be due partly to disruptions and/or reporting biases caused by the pandemic. For example, there were some news reports about pregnant women forgoing ultrasound tests and losing access to abortion services during the coronavirus lockdown. Thus, it is possible that there could be some “pandemic effect” on our key measures of ultrasound use and sex selection. However, in our analytical sample, births that took place after the pandemic lockdown account for only a small share (5%) of the total number of births in the five years preceding the survey.
Son preference
Researchers follow the conventional approach of inferring son preference based on the survey respondents’ reported “ideal” gender composition of their children: Son preference is identified when the ideal (i.e., desired) number of boys is greater than that of girls.60 We constructed a categorical measure to indicate the level of son preference: wanting more sons, wanting more daughters, and wanting equal numbers of sons and daughters.61
Want to have another child
We also constructed a measure to explore gender bias in fertility planning among currently married women. The NFHS asked women whether they wanted more children, and we recoded those who answered that they prefer to have a/another child as 1 (= want more children), otherwise 0. To examine gender bias, we compared the share of women who want more children among those with no living sons with those with no living daughters.
Ultrasound use and sex selection
The women’s data from the NFHS provides detailed information on all pregnancies reported in the five years before the survey, including ultrasound use during each pregnancy and outcomes including the sex of the child at birth.62
Each round of the NFHS final report includes the analysis of son preference, desire for another child, ultrasound use, and pregnancy outcomes (of ultrasound pregnancies) by religion, education, wealth, caste, and place of residence.63 See the NFHS site for more details.
Estimating “missing” female births
Pew Research Center draws on data from three waves of the National Family Health Survey, collected in 2005-06, 2015-16, and 2019-21, to analyze the number of “missing” female births over the past two decades (2000-19). As discussed above, the NFHS is a well-established source that provides measures of India’s sex ratio at birth, second only to the Indian census in reliability.
We took several steps to ensure the reliability of our “missing birth” estimates. First, we adjusted the original weights for each survey by its sample size, so that each wave has an equal total weight, with guidance from Tom Pullum, Senior Advisor at the Demographic and Health Surveys program, which oversees the distribution of NFHS data. Second, we restricted our analysis to birth histories up to 15 years before the survey to minimize bias and reporting errors.64 To reduce misreporting errors, we also excluded births by women who reported having children at age 13 or younger. Because births to women under 15 are extremely rare, such cases (births before age 13) are likely due to an error in the woman’s own birthdate. Lastly, our analysis focuses on births among all women in the past two decades, between 2000 and 2019.
The number of “missing” female births is derived by comparing the numbers of observed and expected female births. We calculated the number of expected female births by applying India’s natural sex ratio at birth (105.3 boys per 100 girls, or the girl-to-boy ratio of 950 to 1000) to observed male births, which is about the same as the estimated sex ratio at birth before the introduction of prenatal testing in the 1970s.65 Our analysis focuses on “missing” female births in five-year cohorts between 2000 and 2019.
We calculated the sex ratio at birth for four religious groups in India: Hindus, Muslims, Christians and Sikhs. Smaller groups – including Jains, Buddhists and other religious communities – were combined into an “Others” category due to small sample sizes. We consider female-selective abortions evidenced when the sex ratio at birth is above 105.3 boys per 100 girls.
Information on the number of births over the three decades comes from the Sample Registration System (SRS), a large-scale survey that provides statistics on births and deaths in India. The annual number of births in India between 2000 and 2019 is estimated to be around 26 million (2.6 crore).
Our analysis finds that about 9.0 million (0.9 crore) Indian girls went “missing” due to female selective abortions between 2000 and 2019.66 As India’s largest religious group, Hindus make up 79.8% of India’s total population and account for a disproportionate share (86.7%) of the “missing” female births – the estimated number of females babies who were never born but would have been if there were no female-selective abortions. In the past two decades, Hindus “lost” about 7.8 million (0.8 crore) girls to sex-selective abortions, according to our estimates.
The share of female births “lost” among Muslims (6.6%) and Christians (0.6%) during this period is considerably smaller than these groups’ shares of the Indian population (14.2% and 2.3%, respectively). Muslims were “missing” an estimated 590,000 (5.9 lakh) female births, and Christians were “missing” an estimated 53,000 (0.5 lakh), during the period studied.
Sikhs account for an outsized number of “missing” female births – an estimated 440,000 (4.4 lakh). Though Sikhs make up 1.7% of India’s population, they are responsible for approximately 4.9% of the “missing” girls during the period studied.