

The Pew Research survey asked respondents about their personal preferences for medical treatment in different scenarios. A majority of adults (57%) say they would ask their doctors to stop medical treatment if they had a disease with no hope of improvement and they were suffering a great deal of pain, while 35% would tell their doctors to do everything possible to save their lives in such a situation.
About half of adults (52%) say they would want to stop treatment if they had an illness or condition that made them totally dependent on another person for their care, while 37% say they would want to do everything possible to save their lives in this situation.
Preferences are evenly divided when it comes to an incurable illness or condition that makes it hard to function in day-to-day activities: 46% say they would opt to stop medical treatment, and an equal share say they would want their doctors to do everything possible to save their lives in that circumstance.
Personal preferences about end-of-life medical treatment have changed modestly over time. Compared with 1990, a somewhat greater share of the public today expresses a preference on each of these questions; in addition, a somewhat greater share of adults today say they would tell their doctors to do everything possible to save their lives if faced with an incurable illness. The share of Americans who say they would tell their doctors to stop their treatment so they could die remains about the same as in 1990.

To what extent are public preferences about end-of-life medical treatment consistent across circumstances? About a third of U.S. adults (32%) say they would stop their treatment in all three of the circumstances included in the survey, a fifth (20%) would ask their doctors to do everything possible to save their lives in all three circumstances, and 46% have varying preferences depending on the exact circumstances.
The share of Americans who consistently say they, personally, would stop their treatment so they could die in all three of these cases is roughly the same as it was in 1990 (32% today vs. 30% in 1990). Compared with a 1990 Pew Research survey, more adults today say they would tell their doctors to do everything possible to save their lives (up 6 percentage points) and fewer have varied preferences depending on the circumstances considered (down 7 percentage points since 1990).

Personal preferences about end-of-life medical treatment are strongly related to age and to race or ethnicity.
For instance, adults ages 50 and older are more inclined to say they would stop their treatment so they can die in all three cases considered. Roughly four-in-ten adults ages 50-64 (43%) say this for all three questions, as do similar shares of those ages 65-74 (42%) and those ages 75 and older (41%). By comparison, 23% of adults under age 50 say they would want to stop their treatment in all three circumstances.
In terms of race and ethnicity, blacks and Hispanics are more likely than whites to say they would tell their doctors to do everything possible to save their lives in all three situations; four-in-ten blacks (40%) and about a third of Hispanics (32%) say this, compared with 14% of non-Hispanic whites. By comparison, whites are more inclined to say they would stop their medical treatment in all three circumstances (35%).
Differences among religious groups are more modest and are largely in keeping with differences by race and ethnicity on this summary measure. On the one hand, about a third of white evangelical Protestants (33%), white mainline Protestants (33%) and white Catholics (35%) say they would stop their medical treatment in all three situations. A similar share of the religiously unaffiliated say the same (38%). On the other hand, black Protestants and Hispanic Catholics are more likely to say they would tell their doctors to do everything possible to save their lives in all three cases (42% and 33%, respectively). Among white mainline Protestants, 57% have preferences for medical treatment that vary depending on the circumstances.
Americans who have given a great deal of thought to their own wishes about end-of-life treatment are more inclined to say they would want to stop their treatment so they could die in all three cases (38%, compared with 23% among those who have given little or no thought to their wishes). By contrast, personal preferences about end-of-life treatment are not significantly related to having had a close friend or relative with a terminal illness in recent years. And there is not much difference in personal preference about end-of-life medical treatment based on a person’s own current health status.
Attention to and Experience With End-of-Life Treatment

The amount of thought and attention U.S. adults give to end-of-life issues varies; 37% of adults report having thought “a great deal” about end-of-life treatment prior to taking the survey. Another 35% say they have given “some” thought to these issues and 27% have given “not very much” or no prior thought to their end-of-life preferences.
The share of Americans who say they have given their own wishes about end-of-life treatment a great deal of thought is about the same as in the 2005 survey and up 9 percentage points since 1990 (when it stood at 28%).
Terminal illness has touched the lives of many U.S. adults, 47% of whom have recent personal experience with a close friend or family member suffering from this type of illness. About half of those with such a friend or family member (23% of all adults) report that the issue of withholding life-sustaining treatment arose for that person. Since 2005, experience with a close friend or relative facing a terminal illness is up 5 percentage points.
As expected, experience with a close friend or relative facing a terminal illness cuts across social and demographic groups, including age, gender, education and religious groups. For example, 46% of adults ages 18-49 say a close friend or relative has had a terminal illness or been in a coma within the past five years, and 48% of adults ages 50 and older say the same. However, fewer Hispanics than whites (36% and 50%, respectively) have had a loved one in this situation; among blacks the comparable figure is 45%.


Not surprisingly, experience with a friend or relative facing a serious illness is associated with more attention to one’s own wishes about end-of-life care; 45% of those with a terminally ill friend or relative say they have given a great deal of thought to their own wishes, compared with 31% of those without this kind of close experience.
Thinking about one’s own wishes also is related to a respondent’s age and personal health.
Among adults ages 75 and older, 47% report having given a great deal of thought to their own wishes about end-of-life treatment. By contrast, about a third (32%) of adults ages 18-49 say the same.
Those who describe their current health as fair or poor (of whom roughly half are ages 50 and older) are more likely to have given a great deal of thought to their wishes for end-of-life treatment (47%) compared with those who say their health is good (33%) or excellent (36%).
There are no or only modest differences in the amount of thought given to one’s end-of-life wishes by gender, race and ethnicity. Nor are there significant differences in the likelihood of having given end-of-life issues a great deal of thought by education, religious affiliation or frequency of worship service attendance.
Communicating One’s Wishes About End-of-Life Treatment
Pew Research surveys from 1990, 2005 and 2013 show that a majority of adults say they have talked with someone else about their wishes regarding end-of-life treatment, but substantially fewer have written down these thoughts.

The 2013 survey finds that 35% of adults say they have their wishes in writing or that they have a living will. This is roughly the same share as in 2005 (34%) but up substantially from one-in-six adults (16%) in 1990.9
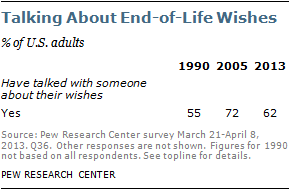
By comparison, having talked with someone else about end-of-life treatment preferences is more common. A majority of Americans say they have done so, as was the case in 1990 and 2005. But these figures have fluctuated some over the years. Today, roughly six-in-ten adults (62%) say they have talked with someone else about their wishes, down from 72% in 2005 but up modestly from 55% in 1990.10

Altogether, about two-thirds of the general public has taken some sort of action to communicate their wishes for end-of-life care. A third of adults (33%) have neither talked about their wishes with others nor written their wishes down.
Not surprisingly, younger adults, particularly those under age 30, are less likely to have communicated their wishes about end-of-life treatment. Just 15% of young adults ages 18-29 say they have their wishes about end-of-life care written down. By contrast, six-in-ten adults ages 65 and older have their wishes in writing.
Differences by age are still apparent, even if not as stark, when factoring in both talking about and writing down one’s wishes for end-of-life treatment. About half of adults under age 30 say they have either talked about or written down their wishes (48%), compared with three-quarters of those ages 75 and older.
More whites (74%) than blacks (49%) and Hispanics (50%) have communicated their end-of-life wishes either verbally or in writing. In addition, Americans with more years of formal education are more likely than those with less education to have written down or talked with someone about their end-of-life wishes, and those with higher incomes are more likely than lower-income adults to say they have done this. And, not surprisingly, the amount of prior thought people have given to the issue also is correlated with whether they have talked about or written down their wishes. By contrast, respondents’ personal health status is not significantly related to whether or not they have communicated their end-of-life wishes either verbally or in writing.
