While half of Americans disapprove of taking race and ethnicity into account in college admissions decisions for the purpose of increasing diversity and a third approve, the public offers a mix of positive and negative views about the effects these practices might have.
Partisans differ over the effects of considering race and ethnicity in college admissions decisions
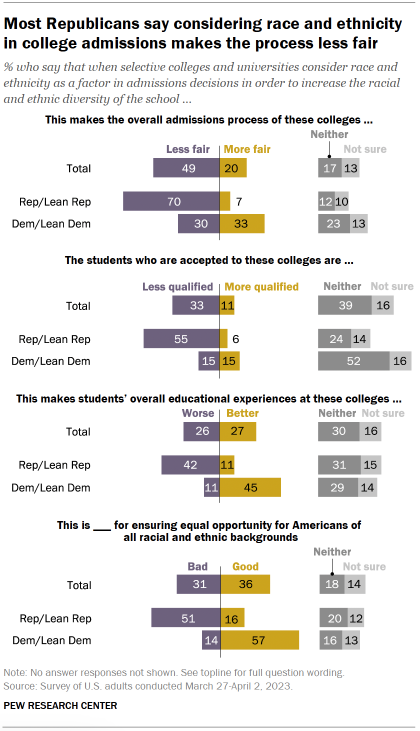
Partisans largely differ in their opinions on how colleges and universities considering race and ethnicity in admissions decisions affects students, the college environment and equal opportunity in the country.
Republicans are more likely than Democrats to say considering race and ethnicity in college admissions has negative impacts in all of the four areas asked about in the survey.
Fairness of the admissions process
Republicans and those who lean to the GOP are particularly likely to hold the view that these practices make the overall admissions process less fair: 70% say this, while just 7% say they make the process more fair (22% say either that they do not have an effect or that they are not sure).
By comparison, Democrats and Democratic leaners are about equally likely to say considering race and ethnicity in college admissions makes the process more fair (33%) as they are to say it makes the process less fair (30%); 37% say either that it doesn’t impact the fairness of the process or that they are not sure.
Ensuring equal opportunity for Americans of all racial and ethnic backgrounds
Democrats view the effects of considering race in admissions decisions more positively. A majority (57%) say it is good for ensuring equal opportunity for Americans of racial and ethnic backgrounds, a view held by just 16% of Republicans.
Students’ educational experience
By about four-to-one, Democrats say that considering race and ethnicity in college admissions makes students’ educational experiences at these schools better (45%), rather than worse (11%). Republicans’ views are the inverse: 42% say these practices make educational experiences worse, while just 11% say they make the experiences better.
Accepted students’ qualifications
Over half of Republicans (55%) say that when colleges consider race and ethnicity in college admissions, the students who are accepted to these schools are less qualified; 6% say they are more qualified, and about four-in-ten say either that these practices result in no change or that they are not sure.
By contrast, about half of Democrats (52%) say that the students who are accepted are neither more nor less qualified when race and ethnicity are taken into account. Just 15% say students are less qualified, equal to the share saying they are more qualified.
Racial and ethnic differences
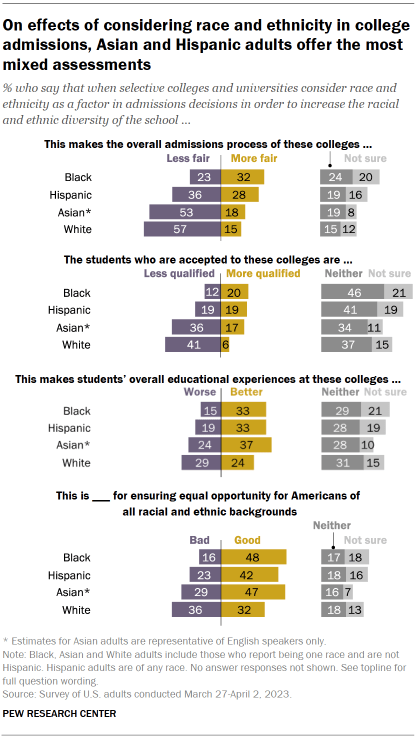
While Black adults’ assessments of the effects of considering race and ethnicity in college admissions are consistently more positive than negative and White adults’ evaluations are more negative than positive, Asian and Hispanic adults’ assessments are more mixed.
Asian adults are more likely to say including race and ethnicity as a factor in college admissions decisions is good for ensuring equal opportunity for Americans of all racial and ethnic backgrounds than they are to say this is bad (47% vs. 29%).
However, Asian adults also are more likely to say considering race and ethnicity makes the overall admissions process of these colleges less fair than to say it makes it more fair (53% vs. 18%).
Asian adults are also more likely to say the students accepted to schools that take race and ethnicity into account in admissions decisions are less qualified (36%) rather than more qualified (17%). About a third (34%) say accepted students are neither more nor less qualified.
For more on Asian Americans’ views on this topic: “Asian Americans Hold Mixed Views of Affirmative Action“
Hispanic adults, on balance, view factoring race and ethnicity into college admissions as having a positive impact on ensuring equal opportunity for Americans of all racial and ethnic backgrounds (47% say it is good, while 23% say it is bad).
But Hispanic adults are more divided over the effect on the fairness of the admissions process (36% say it makes the process less fair, 28% say it makes the process more fair) and the impact it has on the qualifications of admitted students (19% say it results in less-qualified students, while an identical share say it results in more-qualified students).
Educational differences
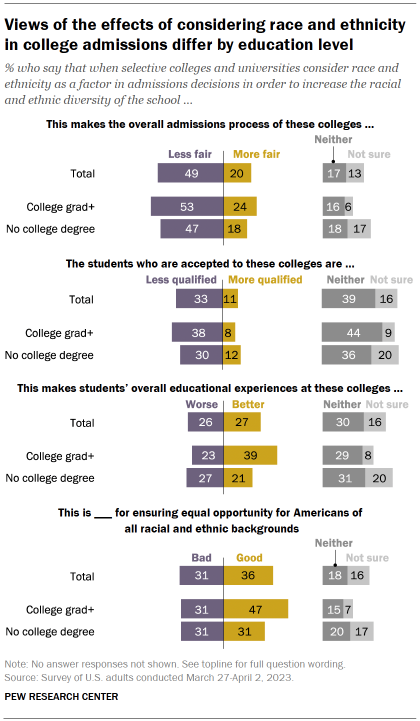
Those with bachelor’s degrees or more formal education are generally more likely to offer an opinion on what the effects are of considering race and ethnicity in college admissions decisions, and their responses are generally more positive.
For instance, college graduates are more likely than those without a degree to say that the consideration of race and ethnicity has positive effects on students’ educational experiences (39% vs. 21%, respectively) or ensuring equal opportunity for all Americans (47% vs. 31%).
However, in their assessments of the fairness of these processes, similar shares of those with a college degree or more education (53%) and those with some college experience or less education (47%) say considering race and ethnicity as a factor in admissions decisions makes the overall admissions process less fair.
Supporters and opponents of considering race and ethnicity in college admissions highlight different areas of impact
Those who approve and disapprove of considering race and ethnicity in college admissions have starkly different evaluations of the effects of these practices. Opponents are particularly likely to see this practice as making admissions less fair, while supporters are particularly likely to see it as having a positive effect on ensuring equal opportunity for all Americans.
Those who disapprove of the consideration of race and ethnicity in admissions decisions overwhelmingly (78%) say this makes the overall admissions process less fair. Views about the effect on the fairness of admissions are more mixed among those who approve of taking race and ethnicity into account: By more than two-to-one, more say this makes the process more fair (46%) than less fair (20%), while about three-in-ten (29%) say it does not affect the overall fairness of admissions.
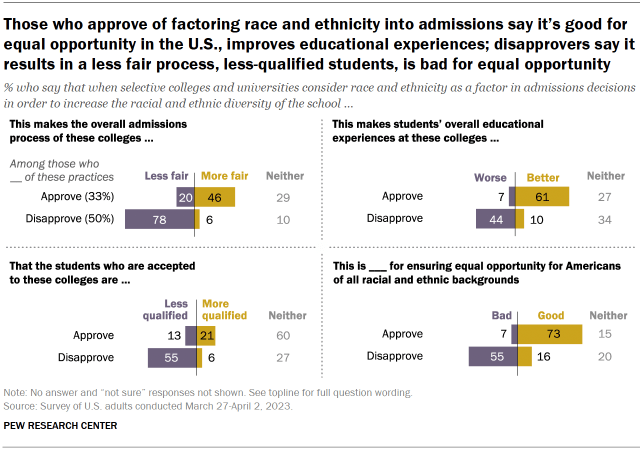
A narrow majority of disapprovers (55%) say that the students accepted by schools that consider race and ethnicity in admissions are less qualified than if the schools did not consider this as a factor. Just 6% say they are more qualified, while about a quarter (27%) say there is no difference in qualifications. In contrast, a majority – 60% – of those who approve of taking race and ethnicity into account in selective college admissions say that accepted students under these practices are neither more nor less qualified, while 21% say they are more qualified and 12% say they are less qualified.
Roughly six-in-ten of those who approve of the consideration of racial and ethnic background in admissions (61%) say that students’ overall educational experience is better at colleges that do this, while 7% say the educational experience is worse. Among disapprovers, 44% say this makes educational experiences worse, while 10% say this makes it better. About a third of those who disapprove of these practices (34%) and about a quarter of those who approve (27%) say it has neither effect.
Approvers and disapprovers are far apart in their views of whether the consideration of race and ethnicity in selective college admissions contributes to equal opportunity for Americans of all racial and ethnic backgrounds. Around three-quarters of approvers (73%) say these practices are good for ensuring equal opportunity, compared with 16% of disapprovers. A majority of disapprovers (55%) say it is bad for ensuring equal opportunity when colleges take race and ethnicity into account (just 7% of approvers say this).
About four-in-ten adults see negatives, no positives from race and ethnicity factoring into college admissions; 30% see only positives
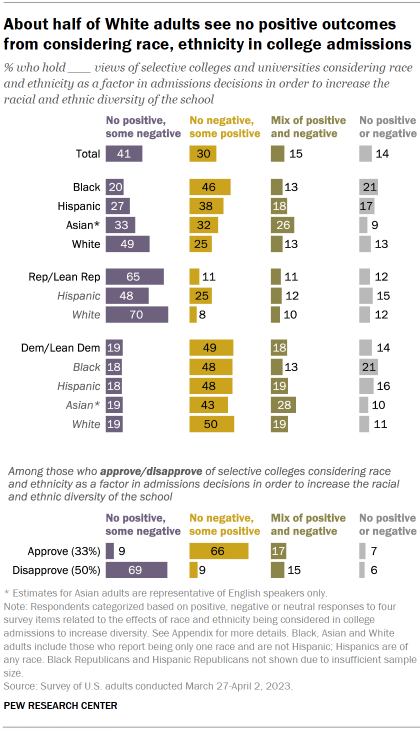
Roughly four-in-ten adults (41%) express negative views and have no positive views of the outcomes that result when colleges consider race and ethnicity in college admissions – meaning they offer at least one negative assessment and no positive assessments across all four survey items about different effects of admissions practices that consider race and ethnicity.
Three-in-ten adults express some positive views and no negative views, while 15% express a mix of both positive and negative and 14% express exclusively neutral assessments (including “neither” and “not sure” response options) on all four items.
Roughly half of White Americans (49%) offer only negative and neutral views, a far higher share than among Americans of other racial and ethnic backgrounds.
Black Americans are more likely than those in other groups to offer no negative views (46% of Black adults provide only positive and neutral responses to all four questions).
Asian Americans are more likely than those in other groups to express a mix of positive and negative assessments of the impact of these practices: 26% of Asian adults have a mix of positive and negative views, compared with 18% of Hispanic adults and 13% each of White and Black adults.
A majority of Republicans (65%) express no positive views on the four items, though there are substantial differences between White and Hispanic Republicans. Seven-in-ten White Republicans express no positive views, compared with 48% of Hispanic Republicans. And a quarter of Hispanic Republicans express no negative views, compared with just 8% of White Republicans.
About half of Democrats (49%) express no negative views of colleges considering race and ethnicity in admissions, with only modest differences between racial and ethnic groups among Democrats.
Personal experiences with efforts to increase racial and ethnic diversity
When asked whether they have ever personally been at a disadvantage in their education, career or job because of efforts to increase racial and ethnic diversity, Americans are about twice as likely to say they have not ever been at a disadvantage as to say they have (57% vs. 24%).
Republicans are 8 percentage points more likely than Democrats to say they have ever personally been at a disadvantage (28% vs. 20%). Within racial and ethnic groups, 35% of Black, 27% of Asian, 23% of White and 20% of Hispanic adults report ever having been at a disadvantage.
About one-in-ten adults (11%) say they have ever personally been at an advantage in their education or career due to efforts to increase racial and ethnic diversity. Similar shares of Black (20%), Asian (18%) and Hispanic adults (15%) say this, compared with 7% of White adults.
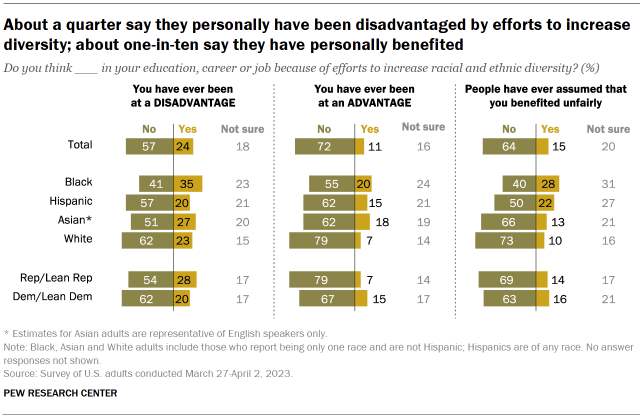
Black adults are more likely than those of other racial and ethnic backgrounds to say that other people have assumed they benefited unfairly from efforts to increase racial and ethnic diversity: 28% of Black adults say this has happened to them, 6 points higher than the share of Hispanic adults who say this. Smaller shares of Asian (13%) and White adults (10%) say this has happened to them.