
Categorization of COVID-19 county health impact in this report
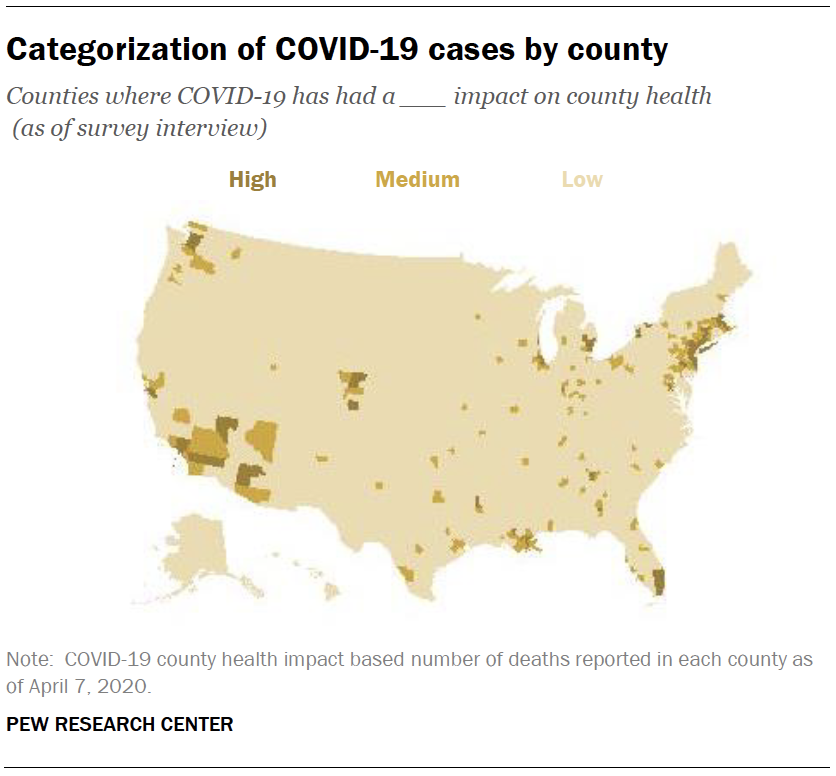
This report uses the number of deaths attributed to COVID-19 in each respondents’ county as a measure of the scale of the health impact of the outbreak for each individual in the survey. Counties are categorized as having a high, medium, or low number of COVID-19 deaths.
Counties were classified as “high” if they had more than 25 deaths as of April 7th. “Low” counties had five or fewer deaths. The remaining counties were classified as “medium” impact.
Data for deaths attributed to COVID-19 by county were taken from the 2019 Novel Coronavirus COVID-19 (2019-nCoV) Data Repository maintained at John Hopkins University (downloaded on April 9th).
Defining income tiers
To create upper-, middle- and lower-income tiers, respondents’ 2018 family incomes were adjusted for differences in purchasing power by geographic region and for household size. “Middle-income” adults live in families with annual incomes that are two-thirds to double the median family income in our sample (after incomes have been adjusted for the local cost of living and for household size). The middle-income range for this analysis is about $40,100 to $120,400 annually for a three-person household. Lower-income families have incomes less than roughly $40,100, and upper-income families have incomes greater than roughly $120,400.
Based on these adjustments, among respondents who provided their income, 33% are lower income, 45% are middle income and 22% fall into the upper-income tier.
For more information about how the income tiers were determined, please see here.
Categorization of battleground states in this report
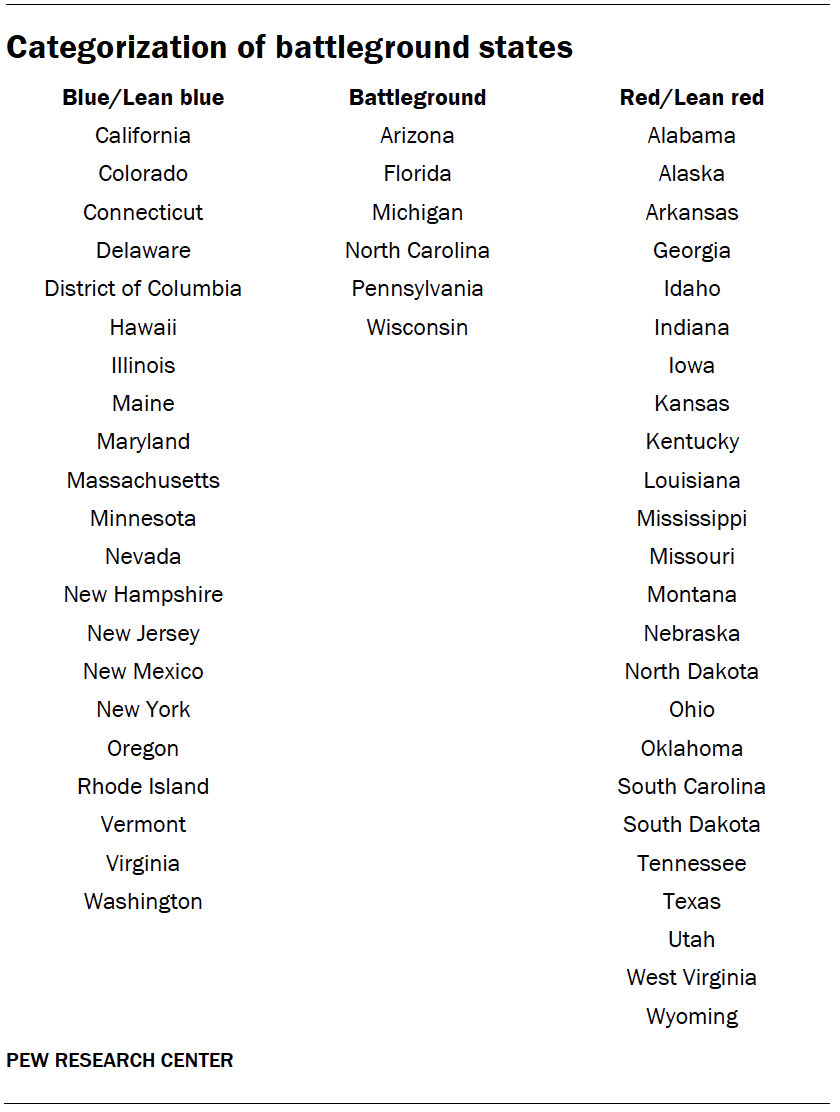
To identify battleground states, researchers consulted several experts’ forecasts (including Larry Sabato’s Crystal Ball, the Cook Political Report, Inside Elections, and Nate Cohen’s ratings) and combined them along with their own judgment to come up with a composite set of ratings for each state. The specific states in each category can be found in the accompanying table.
