
Throughout this report we utilize a scale composed of 10 indicators measured on the Pew Research Center American Trends Panel to gauge financial status. Three dimensions of financial circumstances were used to create the scale – financial assets, financial troubles and government means-tested programs.
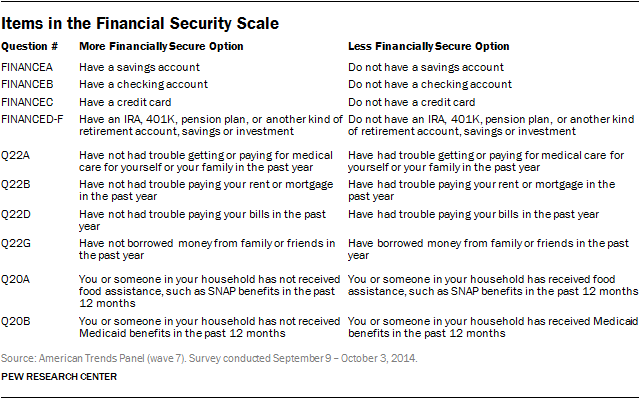
Individual questions were coded as “0” for a more financially secure response and “+1” for a less financially secure response. As a result, scores on the full scale range from “0” (more financially secure responses to all questions) to “+10” (less financially secure responses to all questions). A larger collection of questions were tested for inclusion. The items selected each showed a strong association with overall measures of financial circumstances (e.g., household income, a question asking respondents to characterize their financial situation), but each captured a different aspect of a family’s financial situation (assets, liabilities, outside help). For analytical purposes, respondents are grouped into one of five categories that were roughly equally distributed, as follows:
- 1 : The most financially secure Americans (0)
- 2 (+1)
- 3 (+2 to +3)
- 4 (+4 to +5)
- 5: The least financially secure Americans (+6 to +10)
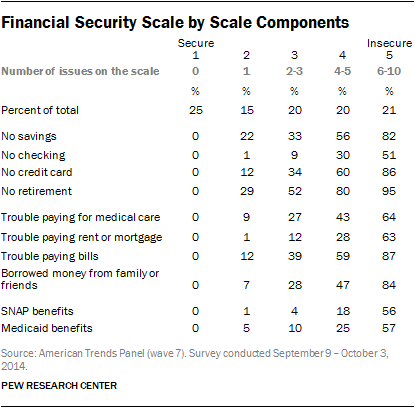
The most secure group (25% of the general public) were those who reported no financial troubles (no difficulty paying for medical care, housing, general bills or having had to borrow money from family or friends), said they had received no government food assistance or Medicaid benefits and reported that they had key financial instruments (checking, savings and a credit card), plus a retirement account of some sort beyond Social Security.
Each of the other groups reflected various combinations of financial difficulties, with the second most secure group having only one issue, the third having two or three issues, the fourth having four to five issues and the fifth and most financially stressed group having six or more financial difficulties.
The scale is strongly associated with family income, but was chosen for this analysis because it reflects the actual levels of financial comfort or discomfort, rather than a summary measure of income that may obscure the situations facing particular individuals. For example, 73% of the most financially insecure (5’s on the scale) are making less than $30,000 annually; however, 7% are making more than $50,000. On the opposite end of the spectrum, only 34% of the most financially secure individuals (according to the scale) make more than $100,000 annually, while 23% of the financially secure are making less than $50,000.


