As Bill Clinton’s lead continues to grow in the latest round of national polls, less and less is heard of the GOP ‘s electoral college advantage. But lurking beneath these national survey numbers is a very uneven regional response to Bill Clinton which has been overshadowed by Bob Dole’s poor showing, so far.
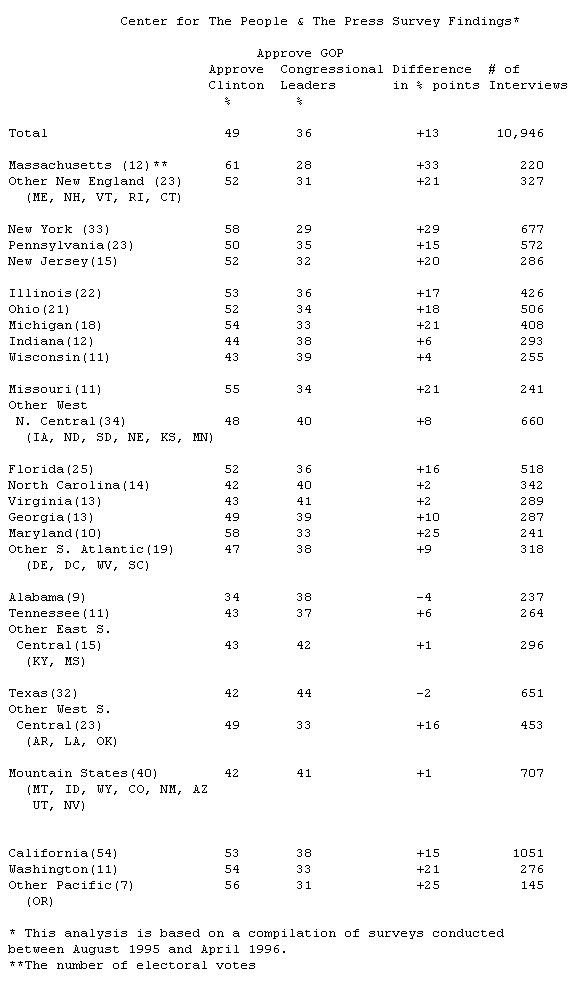
Americans from different parts of the country have judged Bill Clinton and the GOP leadership quite differently over the course of the past 9 months, a time when the President’s star has risen and the Republicans have faltered. During this period, the Center interviewed nearly 11,000 people and found about half (49%) expressing approval of Bill Clinton and little more than a third (36%) approving of the GOP congressional leadership. When these responses are broken down to the state and subregion level, the following political landscape emerges.
Dole Territory Reactions to the President and the Republican leaders have not matched the national pattern in much of the South, the Mountain states and in some parts of the Midwest. Clinton approval ratings have been below 50% and the GOP Congressional leadership has received relatively better ratings here. Such states and regions account for 191 electoral votes. In Texas, Virginia, and North Carolina, for example, the President’s approval ratings have been in the low 40’s.
Disposed to Clinton Many more electoral votes (262) can be found in Northeastern, industrial Midwestern, and Pacific states where Clinton’s ratings have been above 50% and GOP ratings have been about 36% or less over the past 9 months. But a number of these states (accounting for 140 electoral votes) do not have strong Democratic voting histories, and/or have popular Republican Governors. Most notably, Clinton’s ratings have averaged just above the 50% mark in the major industrial states such as Illinois, Ohio, and Michigan and in the key Sun Belt states, California and Florida. In New Jersey and in the small New England states, Clinton’s ratings are not particularly strong, but that is offset by the GOP leadership’s abysmal ratings.
Solid Clinton In contrast, in the many fewer traditional Democratic states, New York, Maryland, and Massachusetts, for example, the President’s approval ratings approach 60%, while only half as many approve of the Republican leadership.
Swing States Another category of states and subregions rate the President and the GOP leadership close to the national average. These areas account for 78 electoral votes and include important swing states such as Pennsylvania and Georgia.
These data suggest that a modest improvement in Bob Dole’s national standings could make this a much tighter race in the electoral college. Even though the May round of national surveys found Clinton’s support levels in the mid-50’s while Dole barely managed to reach the 40% mark, there are at least two important reasons to think that the race may tighten.
First, because leads in presidential races usually narrow. Consistent leads have only been apparent in races that have pitted popular incumbents against less popular challengers (’56, ’64, ’72 and ’84). The Clinton/Dole race does not fit that pattern. Despite his current advantage, Clinton continues to get an unfavorable rating from as much as 40% of the public. The slightly less popular Bob Dole is rated unfavorably by 44%.
Secondly, Dole will almost certainly get more support than he is now getting from Republicans and Independents who lean Republican. Just 79% of Republicans say they will vote for him — well below their usual 90%+ loyalty level and below the 90% of Democrats now supporting Clinton.

Tax Cuts and Deficit Reduction … In What Context?
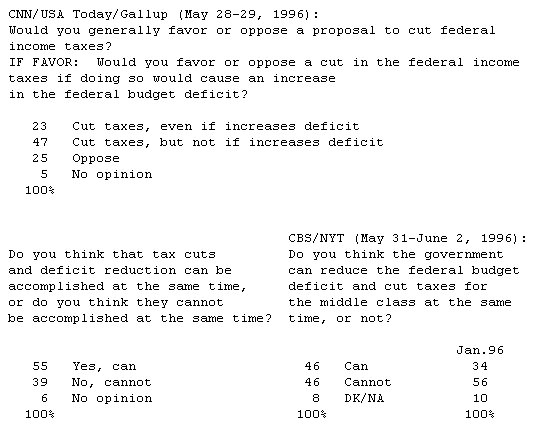
The CNN/USA Today/Gallup poll and the CBS/NYT poll come to different conclusions this month about whether the public believes taxes can be cut and the deficit reduced at the same time. By a 55% to 39% margin the Gallup respondents say yes. The CBS/NYT sample divides 46% yes, 46% no.
Question wordings are comparable, but the context of the interrogations are quite different. This is the first question in the series for CBS/NYT. But Gallup poses the question after first asking respondents if they favor a tax cut, and then asks would they still favor it if it meant no deficit reduction. With this line of questioning some of Gallup’s interviewees may have felt invested in the idea of a tax cut when then asked about the possibility of cutting taxes while balancing the budget.
Context and small wording differences can drive results when the public is asked to give expert opinion about complicated issues. In January CBS/NYT had found a 34% yes, 56% no response to this very same question. But unlike the current poll, the issue was raised after three other questions about the budget deficit.

Chance Error and Horse Race Leads
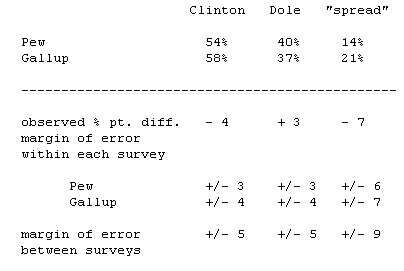
Using the “spread” to report horse race poll results is a common, but often confusing practice. It leads to an exaggerated sense of voter volatility, and it makes the margin of chance error even more mysterious to the statistically challenged. As a case in point, a late April Pew Research Center survey found Clinton leading Dole by 14% points, while a similarly timed CNN/USA Today/Gallup poll found the President leading by 21% points. This sounds like a big difference, one that’s statistically significant, and an indication that voter attitudes are fluctuating widely. None of these things is true.
Pew had Clinton over Dole 54% to 40% among 1,277 registered voters, while CNN/USA Today/Gallup reported a margin of 58% to 37% among 827 registered voters. There is not a statistically significant difference in levels of candidate support between these two polls, given the sample sizes. While each poll has a margin of chance error of +/- 3 or 4 percentage points for its results, a difference of at least 5% points is required in comparing these poll results. (Each survey has an independent margin of chance error that has to be taken into account in a comparison of poll findings.)
And the “spread” has a chance error of almost double that for both within survey and between survey comparisons, because it is not based on a single percentage but on a margin of difference between percentages.


