
By Claudia Deane, Courtney Kennedy, Scott Keeter and Kyley McGeeney
Updated Oct. 24, 2016
Can polls be trusted? This question is on the minds of seemingly everyone who follows the 2016 campaign, though it is hardly unique to this election cycle. The answer is complicated, thanks to myriad challenges facing polling and the fact that pollsters have reacted to these challenges in disparate ways.
Some polls are conducted literally overnight with convenience samples and undergo little or no adjustment. Others are painstakingly fielded for days or even weeks with robust designs and may be adjusted using cutting-edge techniques. These dramatic differences, which have been shown to affect accuracy, are often opaque to news consumers. What follows is a big-picture review of the state of polling, organized around a number of key flashpoints with links to references and research for those who want to better understand the field.
The fast fade of the landline telephone
Landline telephones served as the workhorses of survey research for many years. Found in nearly every home, immovably anchored in one geographic location and providing an implicit promise that a respondent was somewhere relatively private, they dominated the survey landscape for four decades.
The challenge: Landline phones are going the way of the dinosaur, rapidly being replaced by cellphones. According to the National Center for Health Statistics, which tracks their use, fewer than one-in-ten American adults were wireless only 10 years ago. In 2015, nearly half were.
This means that if a pollster only dials landline numbers, they would systematically exclude half the population – and it’s far from a random half. Government estimates show that Americans who have a cellphone but not a landline are disproportionately young and nonwhite, among other differences.
By and large, telephone pollsters reacted to this evolution in one of three ways: by dialing cellphones in addition to landlines; by supplementing landline samples with opt-in samples conducted online; or by continuing to argue that all is well. (See the 2016 Michigan Democratic primary for how that last option can turn out.) Organizations that dial both landlines and cellphones typically use live interviewers, while those mixing landline and online samples tend to use automated telephone surveys known as interactive voice response (IVR).
The research: While independent research on hybrid “landline IVR + internet” designs is scarce, there is a sizable body of knowledge on live interviewer polls that dial landline and cellphone numbers. The results are encouraging. Contrary to claims that the decline of landlines has polling “teetering on the edge of disaster,” there is solid evidence that well-designed telephone polls are as accurate, if not more so, today than they were a generation ago.
A new study demonstrates that as pollsters have been dialing proportionately more cellphones and fewer landlines, data quality has been improving. And Pew Research Center’s latest work on this topic shows that public opinion surveys of U.S. adults could go 100% cellphone and not see a diminution in data quality. That’s a far cry from the mobile phone being the death of survey research! And as for the lament that cellphone interviews cost more than landline, research has explored ways to increase the efficiency of interviewing on cellphones.
The rise of smartphones
These days, it’s common to see people glued to their smartphones. So what are survey researchers doing to take advantage of this powerful technology?
The challenge: Smartphones offer a multitude of ways to invite or remind people to take a survey, as well as a way to collect actual survey responses. Not everybody has a smartphone, however (only 68% of U.S. adults do), meaning that they must be used in conjunction with other contact and data collection methods to ensure everyone can participate in a survey. And even when they can be used they are not without limitations. Obstacles like small screens and technical difficulties abound.
The research: Many studies have been conducted that look at best practices for using smartphones for survey research. Some focus on how to design web surveys to be completed on a mobile device, which is important given that 43% of web panelists in our American Trends Panel complete their surveys on a smartphone. Pew Research Center published a summary of some of these last year that specifically addresses some of the limitations of mobile devices and how to overcome them.
The Center has also experimented with having respondents use a smartphone application to complete a web survey. It was here that technical difficulties proved the most problematic, but in the end the app data held its own compared with data from a web browser survey. The Center has also published a report looking at an experiment using text messages to send survey invitations and reminders. Academic researchers have also experimented with text messages as a contact method for surveys (see one of these two pieces for an example). Another group looked at using text messages for data collection purposes, while still others compared the effect of using text messages for contact versus using them for data collection. The research in this area continues to evolve, but it’s clear that the power of the smartphone has the potential to be harnessed to the benefit of survey research.
Still have the same cellphone number you did in 2006?
One of the major differences between cellphones and landlines is that when people move, they can take their cellphone numbers with them. In many ways, this is a convenience. But it can be a huge headache for pollsters trying to survey at the state or local level.
The challenge: Telephone researchers using random-digit dial (RDD) typically draw a sample of phone numbers from the geographic area being surveyed. For example, if they are polling in Ohio, they draw random samples of Ohio landlines and Ohio cellphone numbers. If people living there have a cellphone number from a different state, they won’t be included in that sample. Similarly, people with numbers associated with Ohio but who are living elsewhere will be called, leading to wasted effort on the part of the pollster. Excluding a group of people such as those newly arrived to a state, especially one that’s shown to be demographically distinct, has the potential to bias survey estimates.
How big of a problem are out-of-area cellphone numbers for pollsters? The answer depends entirely on the geographic population they are trying to target. For national polls, it is not a problem. By dialing nationwide, pollsters reach a target population of “U.S. adults” regardless of any internal mismatch across cities and states. If they then want to report survey findings by geography, researchers can use respondents’ self-reported location rather than the location associated with their cellphone. But for pollsters conducting surveys at the state or local level, especially in areas where the mismatch rate is high, out-of-area cellphone numbers are a serious concern. That’s because self-reported location is not available when selecting the sample of numbers to call.
The research: A new study by Pew Research Center reports that 10% of U.S. adults have a cellphone number that doesn’t match the state where they actually live. For urban dwellers, some 41% have a number that doesn’t match the city where they live. The trend is most pronounced in Washington, D.C., where 55% of residents with a cellphone have a number from outside the District. In some parts of the country, by contrast, this is almost a nonissue. In Michigan, for example, just 5% of adults with cellphones have an out-of-state number. While some technical solutions are in the works, presently there is no surefire way to capture people with out-of-state or out-of-area numbers in subnational telephone polls of adults.
Some practitioners, especially partisan pollsters, sidestep this problem by sampling from a voter file rather than using RDD. Voter files contain whatever telephone number people listed when they registered to vote. In some cases, that is a cellphone number people held on to during a move. Practitioners sticking with RDD, by contrast, typically either just ignore the problem and hope that it does not lead to bias or supplement their survey with cellphone numbers known to have a billing address in the state or city being surveyed.
Election polls
In an election year, it’s impossible to ignore the most prominent member of the polling family: “horse race” polling, so named because its primary use is to determine which candidate is ahead in a particular race at a particular point in time. As has been true in prior cycles, polling was used this year to determine which candidates would appear on stage in debates, as well as to predict the outcome of state party primaries and of course to predict the ultimate prize, the general election. Horse race polling is prone to most of the issues outlined in this report, but it also has an additional challenge that is unique to its purpose: the hunt for the elusive “likely voter.”
The challenge: What sounds obvious is actually notoriously difficult to pull off. To figure out which candidate will win, you need to speak only to registered voters who will actually take the time to vote. And with general election turnout hovering around 60% of the adult population, that means you need to sort out a lot of people. Add to this the fact that admitting that they don’t plan to vote makes some respondents feel bad enough that they indulge in a little wishful answering and you have a real problem. The challenge of predicting how many people will vote and who they will be adds an additional layer of potential error to election polling.
The research: To solve this problem, researchers have developed a hoard of possible “likely voter models” that they can apply to their survey to try to identify those people who will actually turn out on Election Day. These models might, for example, ask respondents how much thought they have given to the election, whether they vote regularly and whether they know where people in their area go to cast their ballots.
One interesting twist is that the modern era of access to actual “voter files” – lists compiled by states and aggregated by commercial vendors that denote which individuals actually voted in which elections – means that researchers no longer have to rely solely on your word as to whether you will vote. They can also check past behavior. Recent research from Pew Research Center finds that models that include information about people’s past voting behavior outperform others.
Other researchers have come at the problem from a different angle. Rather than trying to perfect a likely voter model, they focus instead on fielding large samples and weighting them to very detailed models of the electorate. Specifically, some researchers have had success using advanced statistical techniques, which have catchy acronyms like MrP (multilevel regression and post-stratification) and BART (Bayesian additive regression trees). These techniques can be used to leverage information about the profile of voters in past elections to adjust polling data for an upcoming election.
Researchers applying these methods are less concerned with fielding a nationally representative sample and more concerned with producing heavily modeled estimates that reflect all available information about the electorate. They concede that their samples may be horribly biased but argue that that can be overcome through statistical modeling. Poll consumers interested in the cutting edge of opinion polling would do well to follow firms testing out these types of approaches.
Response rates
Response rates measure how well pollsters are doing in reaching the people they set out to reach. They generally reflect two different but related phenomena: the extent to which researchers can contact their sampled respondent and the extent to which they can convince the respondent to do the interview.
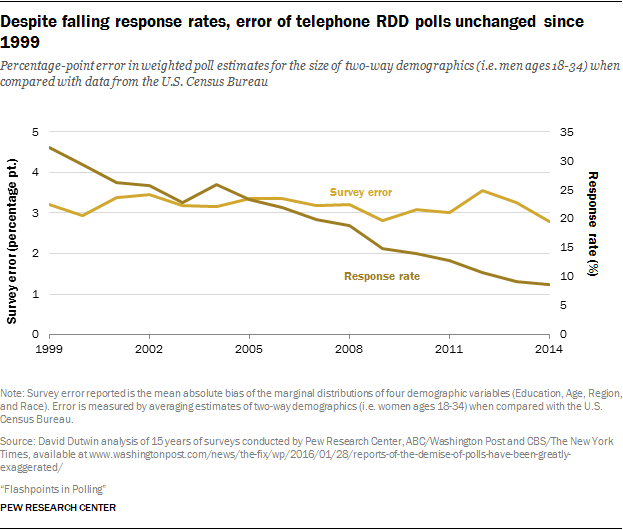
The challenge: Response rates, once seen as a primary indicator of a survey’s quality, have been declining for decades. They are in the single digits for many public polls conducted by nonprofit or commercial organizations. Though this certainly doesn’t look good, nonresponse is only a problem for the poll’s results if the people who don’t talk to pollsters are markedly different than the people who do. Pew Research Center did its first major study of the impact of survey nonresponse in 1997, when the Center’s telephone response rate was 36%. When we updated the study in 2012, the average response rate was just 9%.
The research: Declining response rates have been a fixation for pollsters, who track their ebb like hawks. While few would claim the single-digit rates are something to boast about, research thus far – including the 15-year track compiled by SSRS’s David Dutwin, below – has not suggested that decreasing response rates are leading to increasing error rates. On the other hand, one of the few types of nonresponse bias that has been consistently noted by researchers is the fact that those who participate in surveys are also more likely to participate in civic activities – they are more likely to be “joiners,” in other words. Our own Scott Keeter and Drew DeSilver have a wrap-up on the challenges of polling when fewer people are available to be polled, that covers this issue and others.
Online polls
Online surveys have become a staple of the survey landscape. Enabled by the rise and reach of the internet, they allow researchers to recruit large numbers of Americans into a survey quickly and at low cost.
While some online polls are recruited offline and based on probability samples (see our American Trends Panel), the lion’s share – and the focus of this section – are nonprobability polls. These are polls for which respondents are not selected at random, with a known probability of selection, from a known population. Instead, these are mostly convenience samples, with people being recruited via techniques such as online banner ads. Some of these online polls are done with panels – groups of people who have agreed to respond to an ongoing series of surveys from the same company or organization, while others are one-off polls conducted with people intercepted in the course of some other online activity such as trying to access a website, checking a social media account or using a search engine.
The challenge: Most online polls do not start with a random sample, so researchers must rely heavily on demographic quotas, weighting or other modeling techniques to produce their estimates. Generally speaking, this requires the pollster to adjust for all of the relevant ways that their online sample is different from the U.S. population.
Of course, even well-designed telephone RDD polls require weighting. To date, though, most research has shown that online polls tend to have more error than RDD polls and, thus, require more modeling.
The research: In 2016, online nonprobability surveys play a major role in the survey universe, and here at the Center we are eager to better understand their strengths and weaknesses. A recent study by our methods team looked at nine online surveys conducted by eight different vendors and found their results varied widely. The results from the top performer looked relatively good when compared with high quality government-sponsored benchmark surveys. Others performed less well. One key finding was that extreme caution should be exercised when using online polls to look at data among key racial and ethnic groups, as estimates for blacks and Hispanics based on the online sources tested were particularly inaccurate.
As to the Center’s current approach, our director of survey research recently explained in an online Q&A that “we are planning more work on this topic, but for now it remains experimental. We are still using telephone random-digit-dialing as our primary design, though we employ nonprobability samples for questionnaire testing and for certain specialized studies.”
The leading trade association for survey researchers, the American Association for Public Opinion Research (AAPOR), also issued an in-depth report on nonprobability research in 2013.
‘Nutrition labels’ for polls
The differences in how polls are conducted can be vast. Yet to the average news consumer, such differences are nearly always opaque. Polls are treated as a commodity. Today, poll watchers can be as lost as grocery shoppers before nutrition labeling became mandatory in 1990. Some pollsters provide extensive information on their websites about how they conduct their work, but many do not.
The problem: Standard reporting – which is typically just a poll’s sample size and margin of error – masks important differences between polls in how they are collected and statistically adjusted. In some cases, the differences that are ignored explain why some polls are more accurate than others. Reporters need some way of differentiating polls that are reliable – or at least open about their methodology – from polls that are not.
The research: Enter the Transparency Initiative – the polling community’s major push to encourage pollsters to be open about how they conduct their public polls. This initiative, which has polling organizations pledge to disclose certain essential details about their methods, was launched by AAPOR in 2014 and currently has more than 75 members, including Pew Research Center.
The initiative makes no judgment about the quality or rigor of the methods being disclosed. It simply acknowledges members’ willingness to publicly disclose their procedures. Much as food producers report things like calories and sodium, pollsters belonging to the Transparency Initiative are required to report how their sample was selected, the frame from which it was drawn if there was one, and information about weighting adjustment, among other details. Belonging to the National Council on Public Polls (NCPP) and depositing survey data with the Roper Center for Public Opinion Research are similar, though perhaps less elaborate, indicators that a polling firm is committed to promoting high standards in polling.
But is it doing any good? For data journalists and other reporters looking for a way to know whether to trust a poll, the answer is yes. According to FiveThirtyEight’s Nate Silver, “Participation in the AAPOR Transparency Initiative, NCPP or the Roper Center archive continues to be a strong predictor of polling accuracy.” For poll watchers looking to find out what went into that poll they just consumed, it’s a step in the right direction.
Survey research meets big data
There are now more ways than ever to find out what large numbers of Americans think, value and do. That’s because the digital revolution has made it possible to see what they do via tracking of online behavior; read what they think on Facebook, Twitter and blogs; and determine what they value by where they spend their time online and what they purchase.
The challenge: This kind of “big data” is often in commercial or private hands, unavailable to researchers. It was often created for purposes other than research and so is not designed to answer the questions scholars want to ask of it. And it is most often not fully representative of the populations of interest. (A case in point: not everyone is on Twitter.)
According to Robert Groves, a former Census Bureau director and current Georgetown University provost and Pew Research Center board member, survey researchers are in for 10 years of hard work as they try to grapple with the challenge of bringing this big data to bear on the field of public opinion. In his blog, Groves notes, “The days when a single data source deserves our complete confidence are limited in much social and economic measurement. The future will be won by those deeply attuned to the error properties of the data being blended.”
The research: AAPOR recently produced a comprehensive report on how survey researchers are trying to make use of big data. Pew Research Center launched Data Labs in the fall of 2015 to begin experimenting with new sources of data and new analysis techniques including machine learning, natural language processing and web scraping in order to supplement our more traditional lines of work in survey and demographic research. Watch this space for results over the upcoming months.


