The American Trends Panel survey methodology
Overview
The American Trends Panel (ATP), created by Pew Research Center, is a nationally representative panel of randomly selected U.S. adults. Panelists participate via self-administered web surveys. Panelists who do not have internet access at home are provided with a tablet and wireless internet connection. Interviews are conducted in both English and Spanish. The panel is being managed by Ipsos.
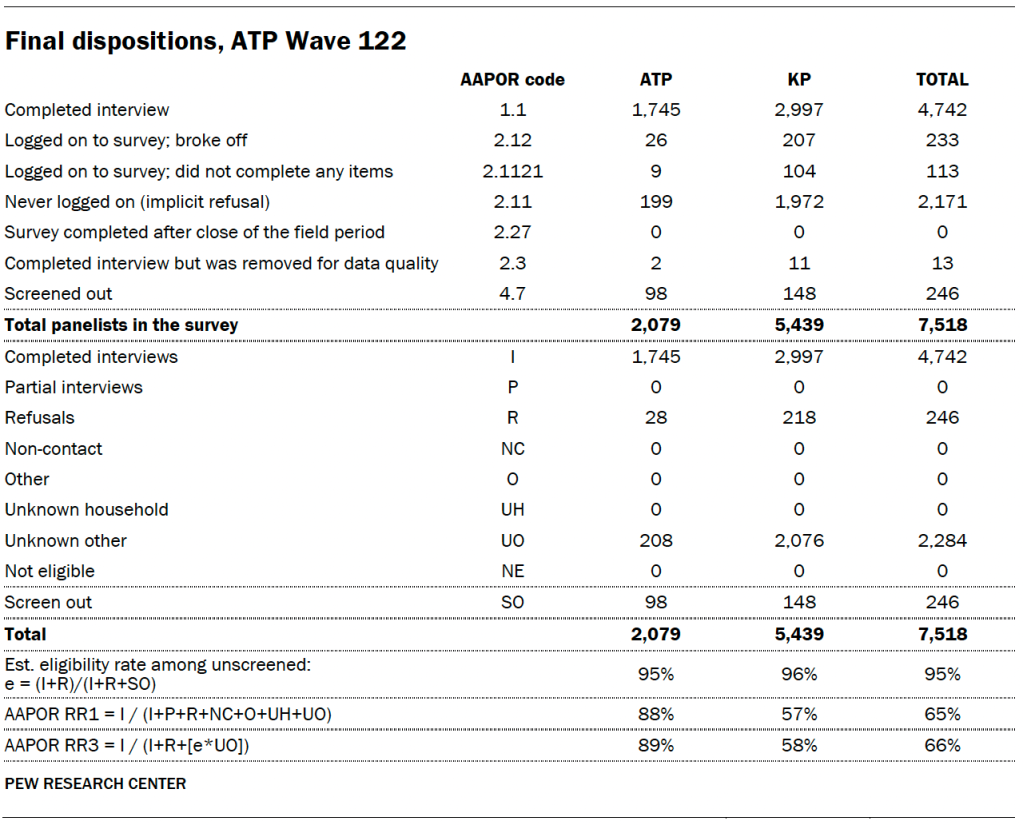
Data in this report is drawn from the panel wave conducted from Feb. 22 to March 5, 2023, among a sample of U.S. adults who identify as Black either alone or in combination with another race or ethnicity. A total of 4,742 panelists responded out of 7,518 who were sampled, for a response rate of 66% (AAPOR RR3). This included 1,745 respondents from the ATP and an additional 2,997 from Ipsos’ KnowledgePanel (KP).
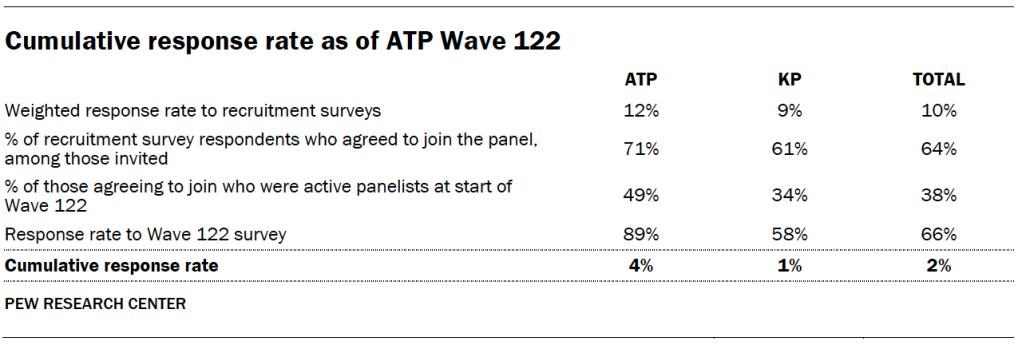
The cumulative response rate accounting for nonresponse to the recruitment surveys and attrition is 2%. The break-off rate among panelists who logged on to the survey and completed at least one item is 5%. The margin of sampling error for the full sample of 4,742 respondents is plus or minus 2.1 percentage points.
Pew Research Center is a subsidiary of The Pew Charitable Trusts, its primary funder. This is the latest report in Pew Research Center’s ongoing investigation of the state of news, information and journalism in the digital age, a research program funded by The Pew Charitable Trusts, with generous support from the John S. and James L. Knight Foundation.
Panel recruitment
The ATP was created in 2014, with the first cohort of panelists invited to join the panel at the end of a large, national, landline and cellphone random-digit-dial survey that was conducted in both English and Spanish. Two additional recruitments were conducted using the same method in 2015 and 2017, respectively. Across these three surveys, a total of 19,718 adults were invited to join the ATP, of whom 9,942 (50%) agreed to participate.
In August 2018, the ATP switched from telephone to address-based recruitment. Invitations were sent to a stratified, random sample of households selected from the U.S. Postal Service’s Delivery Sequence File. Sampled households receive mailings asking a randomly selected adult to complete a survey online. A question at the end of the survey asks if the respondent is willing to join the ATP. In 2020 and 2021 another stage was added to the recruitment. Households that did not respond to the online survey were sent a paper version of the questionnaire, $5 and a postage-paid return envelope. A subset of the adults who returned the paper version of the survey were invited to join the ATP. This subset of adults received a follow-up mailing with a $10 pre-incentive and invitation to join the ATP.
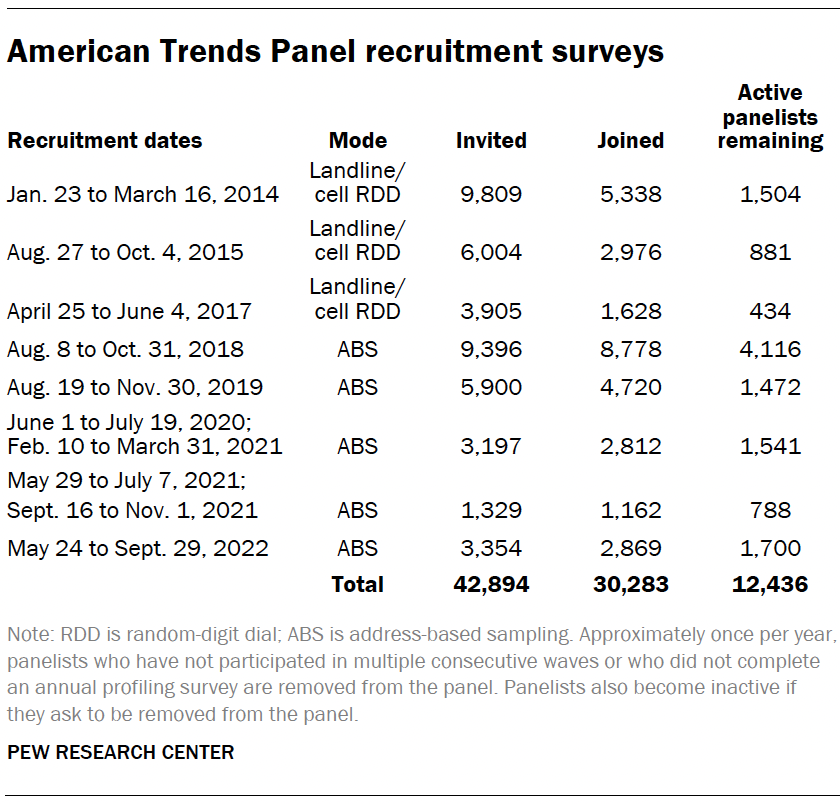
Across the five address-based recruitments, a total of 23,176 adults were invited to join the ATP, of whom 20,341 agreed to join the panel and completed an initial profile survey. In each household, one adult was selected and asked to go online to complete a survey, at the end of which they were invited to join the panel. Of the 30,283 individuals who have ever joined the ATP, 12,436 remained active panelists and continued to receive survey invitations at the time this survey was conducted.
The U.S. Postal Service’s Delivery Sequence File has been estimated to cover as much as 98% of the population, although some studies suggest that the coverage could be in the low 90% range.1 The American Trends Panel never uses breakout routers or chains that direct respondents to additional surveys.
Sample design
The overall target population for this survey was non-institutionalized persons ages 18 and older living in the U.S., including Alaska and Hawaii who identify as Black either alone or in combination with another race. All eligible members of both the ATP and Ipsos’ KnowledgePanel were invited to participate in this wave.
Questionnaire development and testing
The questionnaire was developed by Pew Research Center in consultation with Ipsos. The web program was rigorously tested on both desktop and mobile devices by the Ipsos project management team and Pew Research Center researchers. The Ipsos project management team also populated test data that was analyzed in SPSS to ensure the logic and randomizations were working as intended before launching the survey.
Incentives
All ATP respondents were offered a post-paid incentive for their participation. Respondents could choose to receive the post-paid incentive in the form of a check or a gift code to Amazon.com or could choose to decline the incentive. Incentive amounts ranged from $5 to $20 depending on whether the respondent belongs to a part of the population that is harder or easier to reach. Differential incentive amounts were designed to increase panel survey participation among groups that traditionally have low survey response propensities.
Ipsos operates an ongoing modest incentive program for KnowledgePanel to encourage participation and create member loyalty. The incentive program includes special raffles and sweepstakes with both cash rewards and other prizes to be won. Typically, panel members are assigned no more than one survey per week. On average, panel members complete two to three surveys per month with durations of 10 to 15 minutes per survey. An additional incentive is usually provided for longer surveys. For this survey, during the last few days of data collection, KnowledgePanel members who self-identified as Black were offered 10,000 points (equivalent to $10) in addition to the regular incentive program in an attempt to boost the number of responses from panel members who identified as Black American.
Data collection protocol
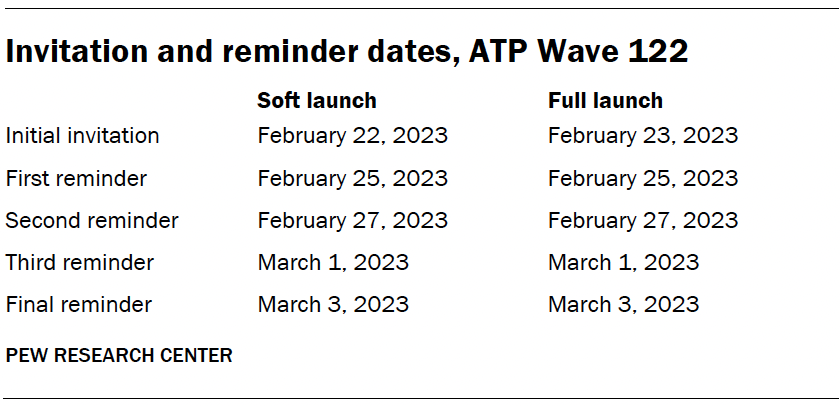
The data collection field period for this survey was Feb. 22 to March 5, 2023. Postcard notifications were mailed to all ATP panelists with a known residential address on Feb. 22.
Invitations were sent out in two separate launches: soft launch and full launch. Thirty-nine ATP panelists and 300 KP panelists were included in the soft launch, which began with an initial invitation sent on Feb. 22. The ATP panelists chosen for the initial soft launch were known responders who had completed previous ATP surveys within one day of receiving their invitation. All remaining English- and Spanish-speaking panelists were included in the full launch and were sent an invitation on Feb. 23.
All panelists with an email address received an email invitation and up to four email reminders if they did not respond to the survey. All ATP panelists who consented to SMS messages received an SMS invitation and up to four SMS reminders.
Data quality checks
To ensure high-quality data, the Center’s researchers performed data quality checks to identify any respondents showing clear patterns of satisficing. This includes checking for very high rates of leaving questions blank, as well as always selecting the first or last answer presented. As a result of this checking, 13 respondents were removed from the survey dataset prior to weighting and analysis.
Weighting
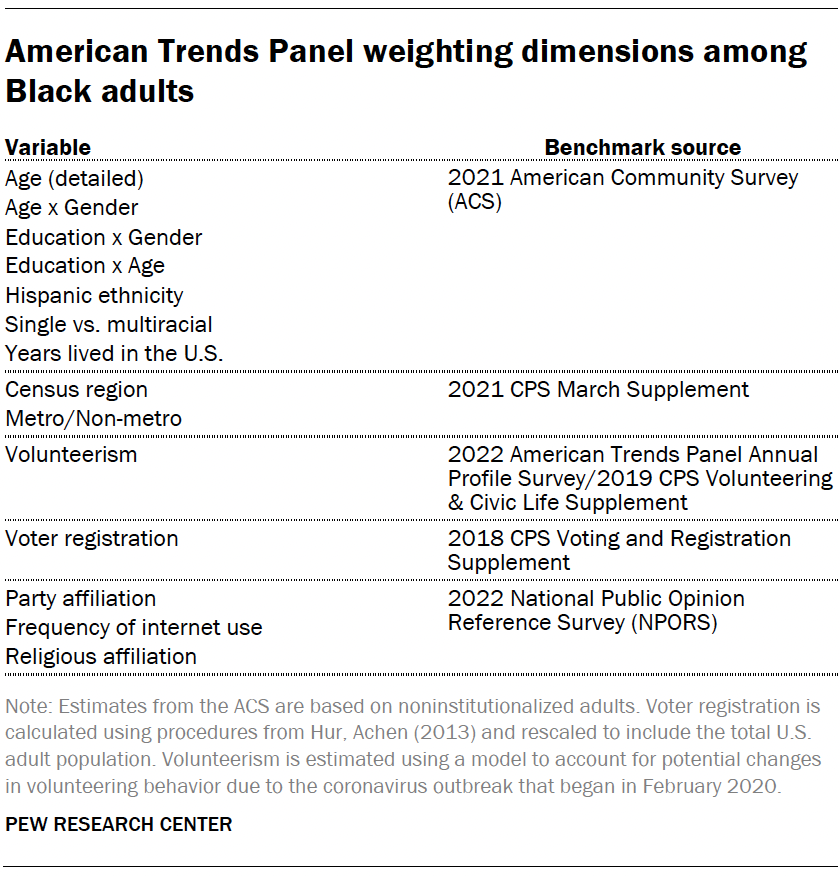
The data is weighted in a multistep process that accounts for multiple stages of sampling and nonresponse that occur at different points in the survey process. First, each panelist begins with a base weight that reflects their probability of selection for their initial recruitment survey. That weight is then adjusted to account for nonresponse to the recruitment survey and panel attrition. Next, the weights for ATP and KnowledgePanel respondents are separately scaled to be proportional to their effective sample size.
The ATP and KnowledgePanel respondents are then recombined and their weights are calibrated to align with the population benchmarks, calculated among respondents to benchmark surveys who identify as Black (alone or in combination), identified in the accompanying table. These weights were then trimmed at the 1st and 99th percentiles to reduce the loss in precision stemming from variance in the weights. Sampling errors and tests of statistical significance take into account the effect of weighting.
The following table shows the unweighted sample sizes and the error attributable to sampling that would be expected at the 95% level of confidence for different groups in the survey.
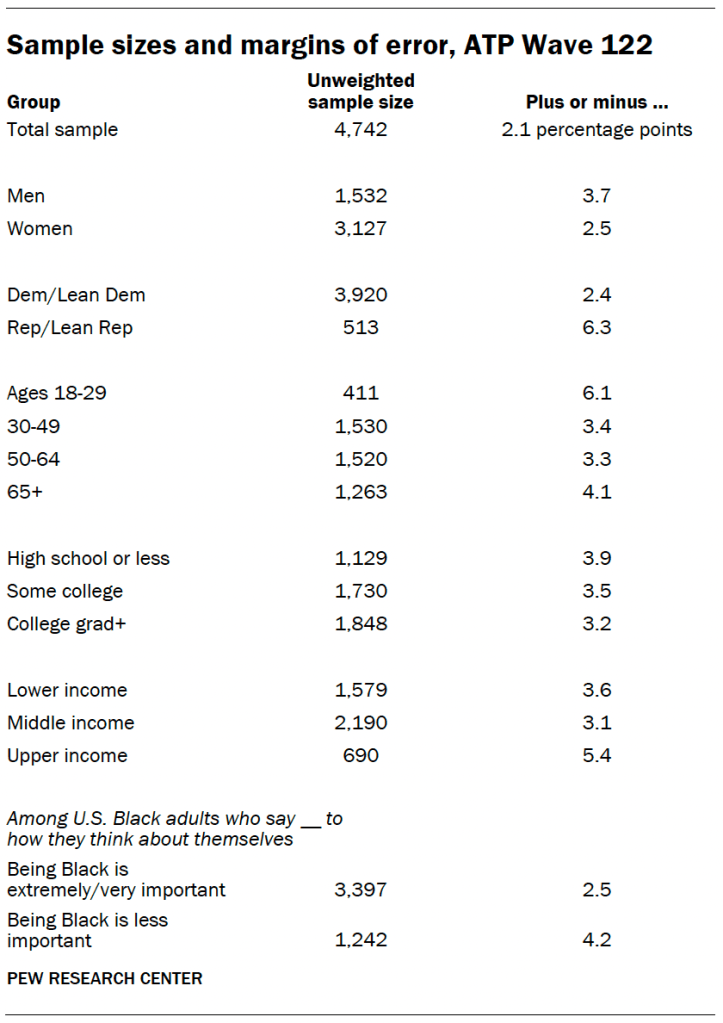
Sample sizes and sampling errors for other subgroups are available upon request. In addition to sampling error, one should bear in mind that question wording and practical difficulties in conducting surveys can introduce error or bias into the findings of opinion polls.
Dispositions and response rates
Adjusting income and defining income tiers
To create upper-, middle- and lower-income tiers, respondents’ 2021 family incomes were adjusted for differences in purchasing power by geographic region and household size. “Middle-income” adults live in families with annual incomes that are two-thirds to double the median family income in the panel (after incomes have been adjusted for the local cost of living and household size). The middle-income range for the American Trends Panel is about $43,800 to $131,500 annually for an average family of three. Lower-income families have incomes less than roughly $43,800, and upper-income families have incomes greater than roughly $131,500 (all figures expressed in 2021 dollars).
Based on these adjustments, 41% of respondents in Wave 122 are lower income, 43% are middle income and 11% fall into the upper-income tier. An additional 5% either didn’t offer a response to the income question or the household size question.
For more information about how the income tiers were determined, please read the methodology here.
Questionnaire pretesting
A portion of the questionnaire was extensively pretested with a series of 15 interviews conducted online with a live interviewer. The purpose was to get a sense of how and why people were responding, reacting and understanding each question. Results from these pretests were used to fine-tune the questions in the final questionnaire.
Focus groups
Pew Research Center conducted a series of focus groups as part of a study exploring Black Americans’ views of and experiences with news and information. The focus groups were facilitated by PSB Insights for Pew Research Center. Nine focus groups were held virtually with participants from across the U.S. Each participant had to meet certain criteria to be eligible:
- They must confirm that their race was Black or African American. This included those who also identified as Hispanic or multiracial.
- They must have internet access and a computer with a working webcam.
- They must be willing to attend an online focus group on a particular date and time.
- They must read and sign an informed consent form detailing their participation in the focus group.
Additional demographic data, such as political leaning, household income, and region, were collected to ensure a diverse mix of participants.
The primary goal of these focus groups was to inform the development of the survey. This survey is the main source of data for this report. The report includes a number of quotations from the focus groups to help illustrate and add nuance to the survey findings. Quotations are chosen to provide context and are not necessarily representative of the majority opinion of any group. Quotations may have been edited for grammar, spelling and clarity.
Each focus group consisted of four or five adults coming together for about an hour and a half for a discussion led by a professional moderator using a guide developed by Pew Research Center with support from PSB Insights and the moderator.
In addition to being Black to be eligible for the focus groups, most groups were made up of people who shared a common characteristic. Beyond that common characteristic, each of the groups was recruited to have a mix of other characteristics and attitudes as appropriate, including gender, education, income, age, race or ethnicity, political party affiliation, urban, suburban and rural location, employment status and amount of trust in the news media. The nine focus groups are the following:
- “General population” – Participants included a mix of demographic characteristics and news habits. Two of these groups were conducted.
- “Parents” – Participants were parents or guardians of at least one child under the age of 18 living in their household
- “Younger adults” – Participants were ages 18 to 24
- “Older adults” – Participants were ages 60 and older
- “Women” – Participants were those who identified as women
- “Low news attentiveness” – Participants were those who said they follow the news “only now and then” or “never”
- “Low household income” – Participants were those whose 2021 pretax household income was less than $35,000
- “Republican/lean Republican” – Participants were those who identified as Republican or as independents who lean toward the Republican Party
The focus groups were conducted between July 26 and Aug. 4, 2022. Focus groups were about 90 minutes in length with 25 minutes allocated to introductions, warm-up questions and debriefs.
PSB Insights worked with RRU Global to recruit participants using a screener designed by Pew Research Center. Participants were recruited through a targeted email outreach from RRU Global’s panel and from their Facebook page. After participants were screened for eligibility, Pew Research Center ranked participants in order of priority to be seated in each focus group with the goal of getting a diverse range of voices in each focus group.
Participants were given an incentive of $175 for their participation in the focus groups. In addition, in order to encourage participants to arrive early to the focus groups to ensure that audio and video connections were functioning properly, a $25 “early bird” raffle was offered to participants in each group.
The topics for discussion during the focus groups were as follows:
- Stage I: Introductions
- Stage II: Daily life
- Stage III: Community connections and experiences
- Stage IV: Local news and information
- Stage V: Trust in media and verification
- Stage VI: Closing
© Pew Research Center, 2023