The findings in this report are based on several distinct methodologies and data sources.
Researchers conducted a census of reporters covering all 50 statehouses in the United States. This census was conducted with the goal of being as complete as possible, knowing that the accounting was dependent on self-reported data that researchers would take steps to verify. The census took place from Sept. 23, 2021, to March 11, 2022. Through this process, researchers identified 1,724 statehouse reporters in the U.S.
Researchers also conducted in-depth interviews with reporters, editors, legislative staff and industry experts to gather further insights on statehouse coverage. This information is incorporated throughout the report and featured in Chapter 4.
Finally, researchers gathered information from contacts in the Native American community about how reporters are covering tribal governments.
This report was funded by The Pew Charitable Trusts, with generous support from the John S. and James L. Knight Foundation and Arnold Ventures. It is the latest report in Pew Research Center’s ongoing investigation of the state of news, information and journalism in the digital age, a research program funded by The Pew Charitable Trusts, with generous support from the John S. and James L. Knight Foundation.
Statehouse reporter data collection
Contact list
Researchers found no publicly available, comprehensive database that lists every news organization and every journalist covering statehouses across the United States. Therefore, researchers compiled as comprehensive a list as possible of news organizations in the U.S. and their journalists’ contact information, pulled from many different industry sources, directories, media and public relations databases, statehouse accreditation lists, and statehouse press association membership lists.
These are the main industry sources used to create the initial list of outlets, bureaus and networks. When contact information was missing in these lists, web searches and other external media contact lists were used to fill in any contact information for the news organizations in the lists below.
- Newspapers: Researchers collected 1,624 individual newspapers (sources: Editor & Publisher, Alliance for Audited Media).
- Local television stations: Researchers collected 954 local television stations that had a news director (source: BIA Advisory Services’ MEDIA Access Pro).
- Radio stations: Researchers collected 397 radio stations that had a news director (source: BIA Advisory Services’ MEDIA Access Pro).
- Public radio: Researchers collected 129 public radio licensees (source: Public Media Futures, a project funded by the Wyncote Foundation).
- Digital nonprofits: Researchers collected 143 active outlets that were previously included in the 2014 sample. Outlets that had gone defunct were removed (source: Pew Research Center database of digital nonprofit news outlets).
- New nonprofits: In addition to the digital nonprofits above, researchers collected 329 nonprofit news outlets not included in our prior study (source: Institute for Nonprofit News, The Future of Media Project’s Index of Emerging Nonprofit Media and Donors (Harvard), and Michele’s List).
- AP state bureaus: Researchers collected every bureau of The Associated Press (source: AP website).
- Legislative correspondent association members: Researchers collected contact information for reporters and news outlets included in public membership lists for legislative correspondent associations (source: online membership lists for state legislative correspondent associations).
Members include the following: Colorado (41 members), Illinois (25 members),
Iowa (12 members), Kentucky (25 members), Louisiana (14 members), Massachusetts (21 members), Minnesota (55 members), Missouri (12 members), New York (47 members), North Carolina (34 members), Ohio (50 members), Pennsylvania (29 members) and Virginia (38 members). - Statehouse reporters: Researchers identified 50 journalists in an external media contact database that included “statehouse” or “state house” in their job title.
- State, local and regional reporters: Researchers identified 205 journalists in an external media contact database that cover state government, local news or regional news.
As the lists were not mutually exclusive, duplicates were removed. The list of outlets and their contact sources were used as the initial contact list. Researchers then relied on other methods described below to collect complete data on the number of statehouse reporters.
After the initial data collection, researchers updated the original list of outlets, bureaus and networks based on various validation steps that were taken. These included: consolidating outlets in group entities if staff is shared (e.g., newspaper networks, groups of television stations), marking outlets as defunct if they were no longer operating, and adding outlets learned about via the data collection process.
The intake form
Researchers designed an intake form as the first step in identifying statehouse reporters and then having those reporters help identify others. The form asked individuals for the number of statehouse reporters their organization employed – whether full time, part time, students or other – and to name other individuals or organizations covering the same statehouse. The intake form also asked them which statehouses their organization covered, and other details about their statehouse reporting.
News outlets with multiple or joint bureaus
The Associated Press, which has bureaus across the U.S., provided researchers with staffing information for all of their statehouse reporters, though some follow-ups were needed to confirm employment status information. Researchers also contacted several large newspaper chains, which often have joint bureaus, to confirm staffing information and to remove any overlapping or duplicated data.
Initial outreach
From Sept. 23 to Dec. 16, 2021, Pew Research Center invited approximately 5,000 news organization contacts nationwide to provide input on the number of statehouse reporters at their news outlets.
The form was distributed via SurveyMonkey and email. All respondents were granted anonymity in their responses to the intake form unless they agreed to an interview. At least two rounds of email reminders were sent to ensure maximum participation, and if a contact did not respond to three outreach attempts, researchers then reached out to another contact at that organization, if one existed in the database. In total, 443 reporters and editors completed the form through SurveyMonkey. All data gathered from responses, as well as contact attempt histories, were stored in a database.
Additional steps for data collection
To complement data collected through the intake form, researchers employed two additional steps.
Step 1: Between November 2021 and March 2022, researchers contacted, by phone and email, state government officials in the states that did not have a publicly available legislative correspondents list. This was done to help identify any news organization with a statehouse reporting presence that we did not have data for. These officials were legislative and gubernatorial press secretaries and other employees who credential and interact with journalists. As part of this outreach, officials were also asked to confirm that our lists of current statehouse reporters were accurate. Some newsroom staff who had responded to our intake form were also asked to confirm our current list for a given statehouse. At the end of this process, researchers compiled as exhaustive a list as possible of all the news organizations covering each statehouse.
Step 2: After this process was completed for each state, researchers determined where staffing information was missing for specific outlets in a given state, paying special attention to outlets mentioned as having statehouse reporters by other outlets, and outlets that were included in the 2014 study but were missing from the current data. In this last step, between November 2021 and March 2022, researchers contacted reporters and editors at individual outlets to confirm their staffing information.
If researchers could not verify an organization’s information with the organization itself, they verified that information requiring two external sources, which could include 1) a statehouse reporter covering the same statehouse, 2) a legislative correspondents’ association list, 3) a state official at that statehouse, or in some rare cases 4) information from a reporter’s social media (e.g., describing themselves as a statehouse or legislative reporter) or from an outlet’s staff list on their website.
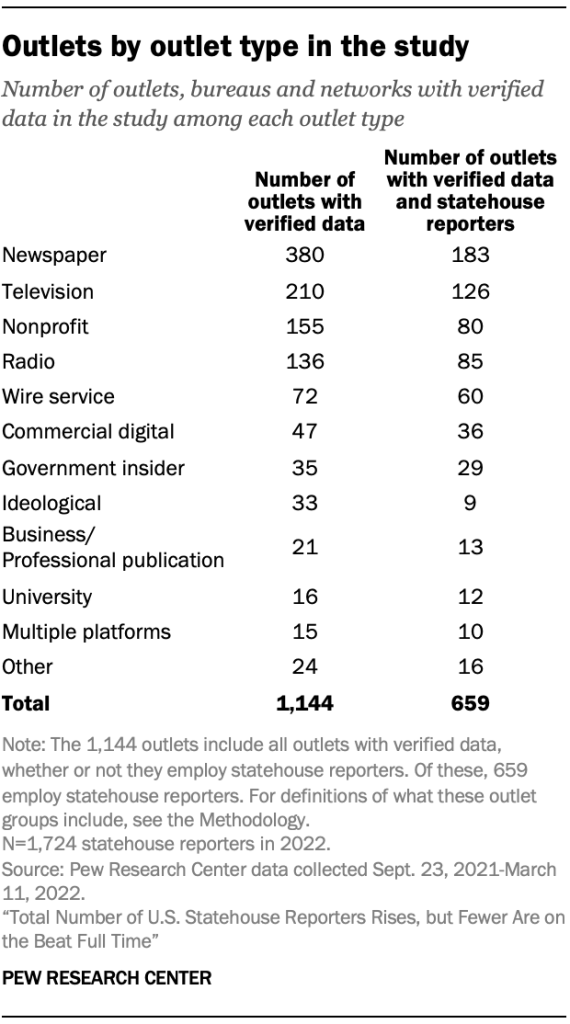
In addition, many respondents provided the names of reporters from other organizations they knew covered the statehouse in their state. Researchers collected these names and contact information and reached out to these individuals for confirmation. In cases where contact information was not provided, researchers asked other statehouse reporters in that state, used media contact lists, and conducted internet searches to acquire the contact information of these individuals. The outlets that employed these individuals received multiple follow-ups by phone and by email, if necessary, for confirmation. In total, researchers verified information for 1,099 active outlets, bureaus and networks (including 440 that had no statehouse reporters), plus an additional 45 that were verified as closed in 2022.
Discrepancies
Throughout this multilayered process, researchers maintained a detailed database containing the information and contact history for every organization included in the study. In the multiple follow-up stages, discrepancies sometimes occurred. These usually came up when two respondents from the same organization provided different staffing information. Researchers contacted these individuals directly to clarify such cases.
With staffing sometimes in flux, a small number of respondents provided a range for the number of reporters covering the statehouse, especially when it varied depending on the year, or (for university-connected outlets) the semester. In these rare cases, researchers entered the lower number provided in the final dataset. Note: This accounting was conducted September 2021 to March 2022. Since this time period, staffing may have shifted due to the commencement or end of legislative sessions and/or newsroom layoffs, departures, restructuring or hiring.
Data analysis
Statehouse reporters were tracked by news outlet, which researchers then categorized according to the outlet’s publication platform or business model. Researchers determined the statehouse a given reporter covers by requesting this information in the intake form; researchers did not determine which state the reporters covered based on the outlet’s physical location.
Unfilled statehouse reporting positions were counted as statehouse reporters if the outlet had plans to fill the position imminently. Vacant positions that the outlet had no immediate plans to fill were not counted.
Definitions of the different types of statehouse employment status
Due to restrictions and limitations imposed by the COVID-19 pandemic, these reporters were not required to be physically stationed at the capitol. More specifically, the following definitions were employed:
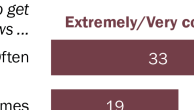
- Full-time statehouse reporter: This category includes reporters assigned full time either year-round or during the legislative session at the time of the study. A year-round statehouse reporter covers the statehouse when the legislature is in session and when it is not in session. In other words, the statehouse is the journalist’s full-time beat. A session-only reporter covers the statehouse full time only when the legislature is in session.12
- Part-time statehouse reporter: This category includes reporters who cover the statehouse fairly often, but also have other assigned areas of coverage, or work only part time.
- Student reporter/intern: This category includes interns and college or university students who conduct statehouse reporting, which could be as part of a university-run news service or as student interns at a news organization.
- Other supporting staff: This category includes staff who do not fit into any of the above categories but nonetheless provide support in the production of statehouse reporting, such as editors, producers or videographers assigned to a statehouse team.
Categorization of news outlets
All the news organizations in the study were categorized into 12 outlet types following a similar categorization as in 2014: newspaper, nonprofit, television, wire service, radio, university, government insider, ideological, commercial digital, business or trade publication, and other. The small number of outlets that fell into multiple categories were categorized as other.
The definitions for each outlet type are as follows:
- Newspapers: Legacy newspapers with a substantial print presence.
- Nonprofits: Nonprofit news organizations. These outlets are typically digital but are not included in the commercial digital category due to their nonprofit status. Public radio and television stations are included in the “radio” and “television” categories respectively. Nonprofit university outlets are included in the “university” category. A small number of nonprofit outlets that have an explicitly stated ideological stance are categorized as “ideological.”
- Television: Television stations and networks.
- Radio: Radio stations and networks, including public radio stations.
- University: Outlets based in colleges or universities, typically staffed by student reporters.
- Wire service: News agencies that supply syndicated news to other outlets. Both national and locally focused.
- Commercial digital: Outlets whose primary mode of publication is digital and are not a nonprofit. A small number of digital outlets that have an explicitly stated ideological stance are categorized as “ideological.”
- Government insider: Newsletters or websites focused on government affairs and aimed at government insiders or other news publications.
- Business/professional publications: Business/law journals and professional trade publications.
- Ideological: Outlets that have publicly stated political orientations or policy goals, by the outlets themselves or their parent organizations.
- Multiple platforms: Outlets that publish and have statehouse reporters on multiple platforms, such as a television and radio station that share a statehouse reporter.
- Other: Includes outlets that do not fit into the above categories, including alternative weeklies and freelance reporters.
In most cases, researchers categorized outlets based on their affiliation within industry associations such as Editor & Publisher, Alliance for Audited Media or BIA Advisory Services’ MEDIA Access Pro. In the rest of the cases, researchers reviewed how news organizations self-identified (typically on the “about” pages of their websites) and used that self-identification to categorize them.
Outlets in 2022 were considered “commercial digital” if they primarily published on the web, did not have a substantial print presence and were not a nonprofit; they were not required to be “born on the web” as they were in 2014. Public radio stations were categorized as radio stations.
In 16 cases, outlets were categorized differently in 2014 and 2022 due to a shift in the outlet’s platform or a discrepancy with the original coding in 2014. These changes do not substantially impact the report’s findings and are based on an assessment of the outlet’s platform in 2022.
State population and legislative session length analysis
Researchers looked at the connection between the number of statehouse reporters and two other variables: state population and legislative session length. The state population data was gathered from the 2020 census residential population count. The legislative session length data was collected from the Council of State Governments’ The Book of the States from 2020 and 2021 (which included 2019 and 2020 data, respectively). Average session length was calculated by averaging the length of each state’s legislative sessions in 2019 and 2020. If states had a two-year session, this length was divided by two, and capped at 12 months.
To test the association between the number of statehouse reporters and a state’s population or session length, researchers ran several regression analyses to determine if state population and legislative session length was correlated with either the number of total statehouse reporters or the number of full-time statehouse reporters. The model using the total number of statehouse reporters found that there was not a significant relationship between legislative session length and total statehouse reporters. However, the model with only full-time statehouse reporters did indicate a significant relationship with both variables. State population and legislative session length are both significantly and positively correlated with the number of full-time statehouse reporters at p<0.05.
In-depth interviews
The findings in most of this report were reinforced and contextualized through interviews with 24 professionals involved in statehouse reporting conducted by Pew Research Center staff. Additionally, Center staff interviewed eight professionals about reporting on tribal governments, discussed below.
The interviews were conducted from Aug. 19, 2021, to Feb. 14, 2022, with people involved in statehouse reporting, in order to better understand the changes and challenges faced by the industry. Interviews and recruitment were handled internally by Center staff, and all candidates consented to have their conversation recorded.
Researchers reached out to four types of professionals involved in statehouse reporting: 1) statehouse reporters, some of whom are also leaders of statehouse press corps or associations; 2) other newsroom staff in editorial or managerial roles at outlets that conduct statehouse reporting; 3) government staff who interact with statehouse reporters; and 4) industry experts.
A total of 76 interview candidates were invited to participate in the study, with a final goal of 20 to 30 interviews. Interview data are not representative of the U.S. public or of members of the statehouse reporting industry. Interview candidates were identified based on several criteria to increase the diversity of the interview pool. Researchers selected potential interviewees to ensure representation across news sectors (newspaper, digital, radio, television, nonprofit, wire service, etc.), outlet sizes, geographical regions of the U.S., partisan control of state governments, job roles of the potential interviewees, and ideological lean of the outlets. Interviewees were recruited on a rolling basis.
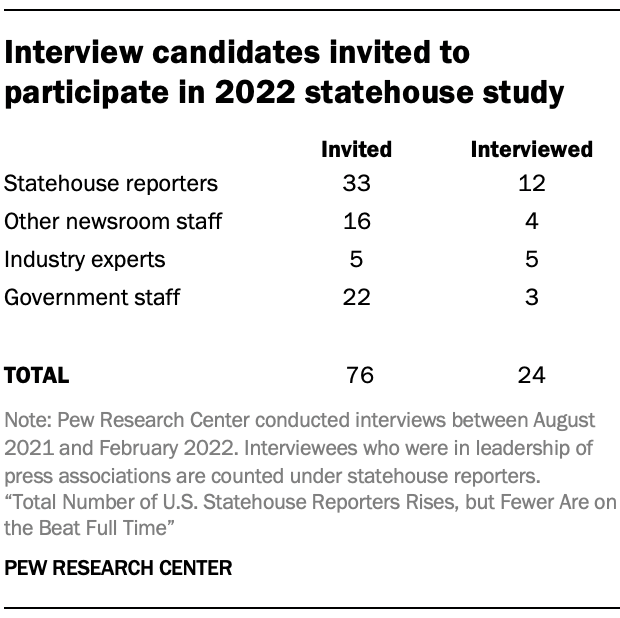
A total of 24 interviews were conducted: five with industry experts, three with legislative staffers, four with newsroom staff in editorial or managerial positions, 12 with statehouse reporters (including three leaders in statehouse press corps associations), and five with industry experts.
Each person interviewed was asked a similar set of about a half dozen questions, with some variation for the individual’s job responsibilities, and follow-up questions were asked when relevant. Interviews were recorded and then transcribed using a third-party transcription service. These transcriptions were used for qualitative analysis and quotations in the report.
Reporting on tribal governments
Researchers gathered information from contacts in the Indigenous community about the number of reporters covering Native American tribal governments.13 To better understand the number of reporters covering tribal governments and structures behind it, Center analysts reached out to reporters, editors, managers and directors from outlets that cover tribal governments and also interviewed eight people with experience in this space.
Data collection
Researchers initially reached out to Native American-affiliated outlets from a list provided by a contact at an outlet that covers Indigenous issues, starting on Nov. 8, 2021, and concluding on March 11, 2022. This initial list included 184 contacts. Contacts were asked whether their organizations had any reporters that cover tribal governments, and if so, how many of them were there and how much they focused on that beat (i.e., whether they also spent time reporting on other topics). Researchers also asked contacts if they had any reporters that covered any U.S. statehouses, and if so, included those responses into the tally of statehouse reporters for the main study.
Researchers also gathered outlet and contact names using information provided by contacts from the initial list and online searches. Researchers then contacted these new outlets. In addition, researchers reached out to other contacts at the same outlet by researching online their staff and about pages. Researchers emailed a contact at each outlet at least twice and followed up via phone call if there was no response.
Outlet categorization
All the news organizations that cover tribal governments were categorized into five outlet types: 1) newspaper or newsletter, 2) digital news outlet, 3) radio, 4) television or 5) multiple outlet types. This was determined in a similar way as in the main analysis: Researchers reviewed how news organizations self-identified (typically on the “about” pages of their websites) and used that self-identification to categorize them.
Researchers also reviewed the outlets’ affiliation with the tribe and recorded whether the news outlet was either owned by or affiliated with the tribal government. There were two outlets in the data where researchers could not confirm any affiliation. Researchers gathered this information from the tribal government website and the outlets’ websites.
External sources
Researchers used data from the 2020 census to determine the current number of self-identified Native Americans living in the United States; it includes any individual identifying as American Indian or Alaska Native (including those who self-identified as being American Indian and Alaska Native in combination with another race). The census and this analysis do not include Native Hawaiians.
Researchers also used tribal grouping metrics from the census to classify each tribal government into a larger tribal grouping; in this case, data from the 2010 census was used, as it was the most current iteration of the tribal grouping data as of March 2022.14
In-depth interviews
Researchers conducted in-depth interviews to better understand how outlets cover tribal governments in Native American communities.
Researchers conducted these interviews with individuals involved in reporting on tribal governments, including reporters and those in editorial or managerial roles in outlets with tribal government reporters. Eight individuals were interviewed in a total of seven interviews (one interview included two participants).
Each person interviewed was asked a similar set of about a half-dozen questions, with some variation for the individual’s job responsibilities, and follow-up questions were asked when relevant. Interviews were recorded and then transcribed using a third-party transcription service. These transcriptions were used for qualitative analysis and quotations in the report.