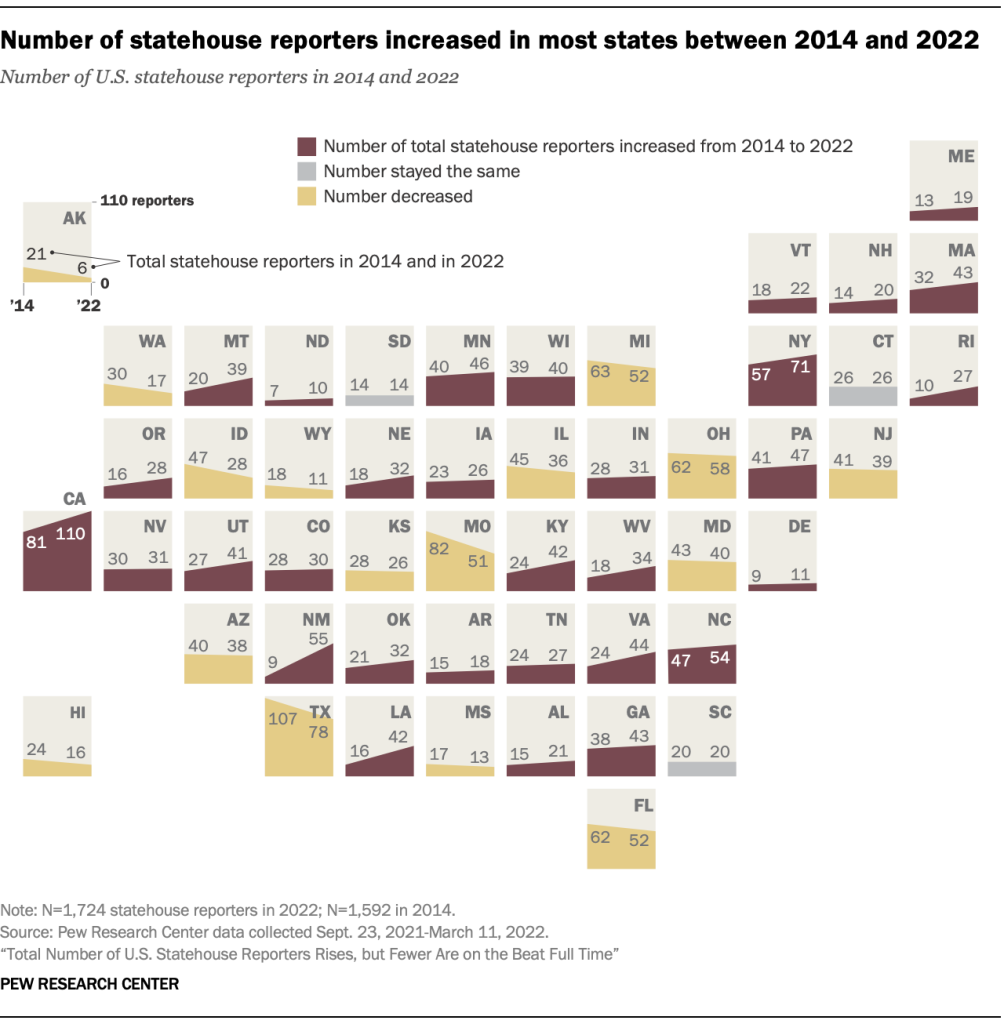
Trends in the number of statehouse reporters vary from state to state. In more than half of states – 31 – the number of statehouse reporters increased between 2014 and 2022, following the national pattern of growth in the total number of reporters covering statehouses. But about one-third of states – 16 in total – experienced decreases in their total numbers of statehouse reporters, including highly populous states such as Florida and Texas and less populated states like Wyoming and Alaska. Three states – Connecticut, South Carolina and South Dakota – retained the same overall numbers of statehouse reporters.
Among those with increases, the size of the increase ranged from the addition of one reporter, like in Wisconsin (from 39 reporters in 2014 to 40 in 2022), to an increase of 46 reporters in New Mexico (from nine reporters in 2014 to 55 in 2022). New Mexico’s press pool grew by a whopping 511%, also the largest gain in percentage terms, largely due to an increase in the number of reporters covering the statehouse part-time.
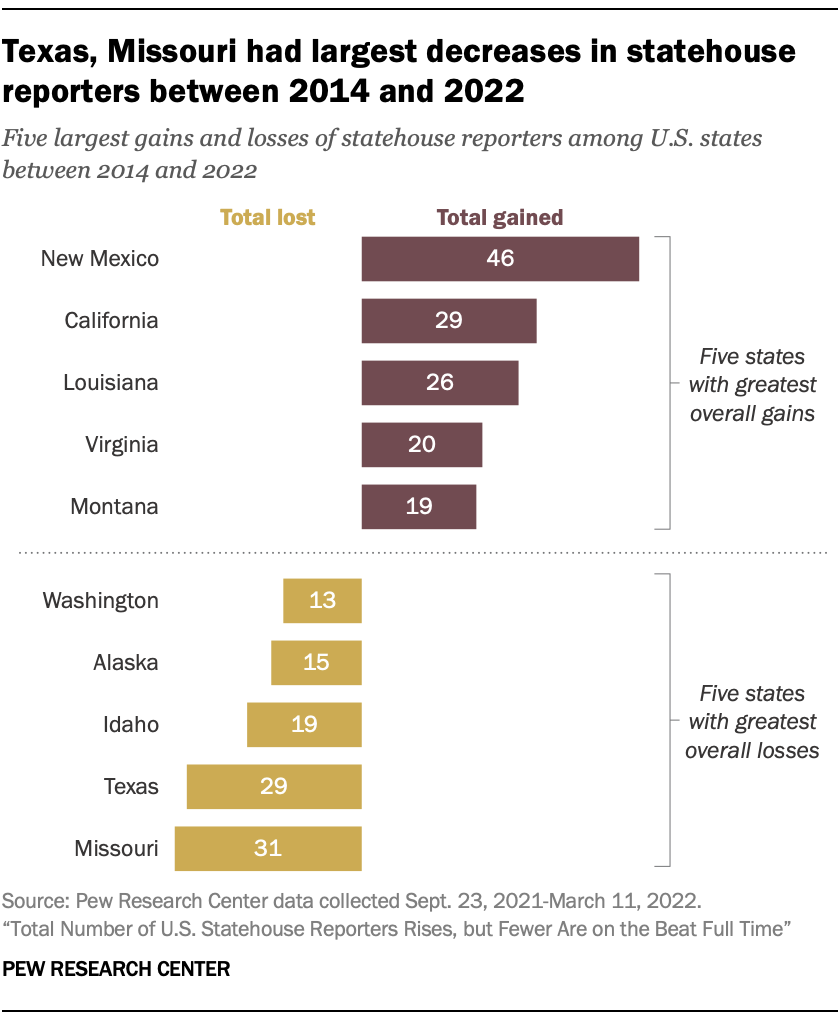
The other states with the largest growth of statehouse reporters were California, Louisiana, Virginia and Montana. In California and Montana, the increases between 2014 and 2022 were driven by the addition of full-time reporters in each state. In other cases, these increases are largely due to growing numbers of part-time and student reporters.
The five states with the largest declines in their statehouse press corps were Missouri, Texas, Idaho, Alaska and Washington. Missouri’s loss of 31 reporters amounts to a 38% decrease in its total number of statehouse reporters since 2014. This was driven primarily by a decline from 51 student reporters in 2014 to 26 in 2022.
Texas’ statehouse press corps shrank from 107 in 2014 to 78 in 2022; this decrease was seen across outlets, with many outlets in Texas losing one or two statehouse reporters since 2014. Meanwhile, Idaho lost a total of 19 statehouse reporters and Alaska and Washington dropped by 15 and 13 since 2014, respectively. In these states, these losses stemmed from multiple outlets downsizing the number of staff dedicated to statehouse reporting.
Betsy Russell of the Idaho Press noted the slow decline of the newspaper’s Boise bureau: “I had three reporters, and then it went down to two, and then it went down to one, and that one just left – and we’re hiring.”
(See detailed tables for more data on the number of statehouse reporters by state)
Where full-time statehouse reporters increased, decreased most
One important indicator of a news organization’s focus on statehouse reporting and the resources available for statehouse coverage is the size of its full-time statehouse reporting staff, which often allows for more ongoing reporting on statehouse issues and events. Focusing on full-time staff also allows researchers to look beyond the volatility in the numbers of part-time staff and students or interns.
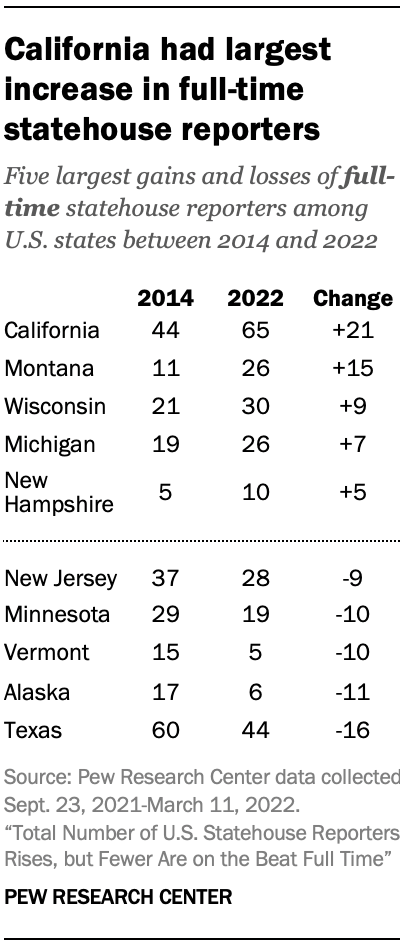
Looking only at the 850 reporters who cover the statehouse full time (either when the legislature is in session or year-round), California rises to the top in terms of most reporters gained from 2014 to 2022 (from 44 to 65). The next four states with the largest increases in full-time statehouse reporters are Montana, Wisconsin, Michigan and New Hampshire.
The states with the largest declines are Texas, Alaska, Vermont, Minnesota and New Jersey, with each state losing between nine and 16 full-time statehouse reporters between 2014 and 2022. Texas had the largest decline, going from 60 full-time statehouse reporters in 2014 to 44 in 2022, a loss of 16.
States with larger populations and longer legislative sessions tend to have more full-time statehouse reporters
The number of full-time statehouse reporters varies dramatically from state to state, ranging from three in Hawaii to 65 full-time statehouse reporters in California. Researchers analyzed two factors that might relate to these differences in statehouse news staffing in each state.
As was the case in 2014, these two factors continue to be related to the number of full-time statehouse reporters in each state. The first is population: In general, the larger a state’s population, according to the 2020 census, the more likely a state is to have a greater number of full-time statehouse reporters.
For instance, seven states – California, Florida, Michigan, New York, Ohio, Pennsylvania and Texas – are among both the 10 most populous states and the 10 with the largest full-time statehouse press corps. In 2014, this was true for eight states. Similarly, seven states – Alaska, Delaware, North Dakota, Rhode Island, South Dakota, Vermont and Wyoming – are now among both the 10 least populous and the 10 with the smallest full-time statehouse press corps.
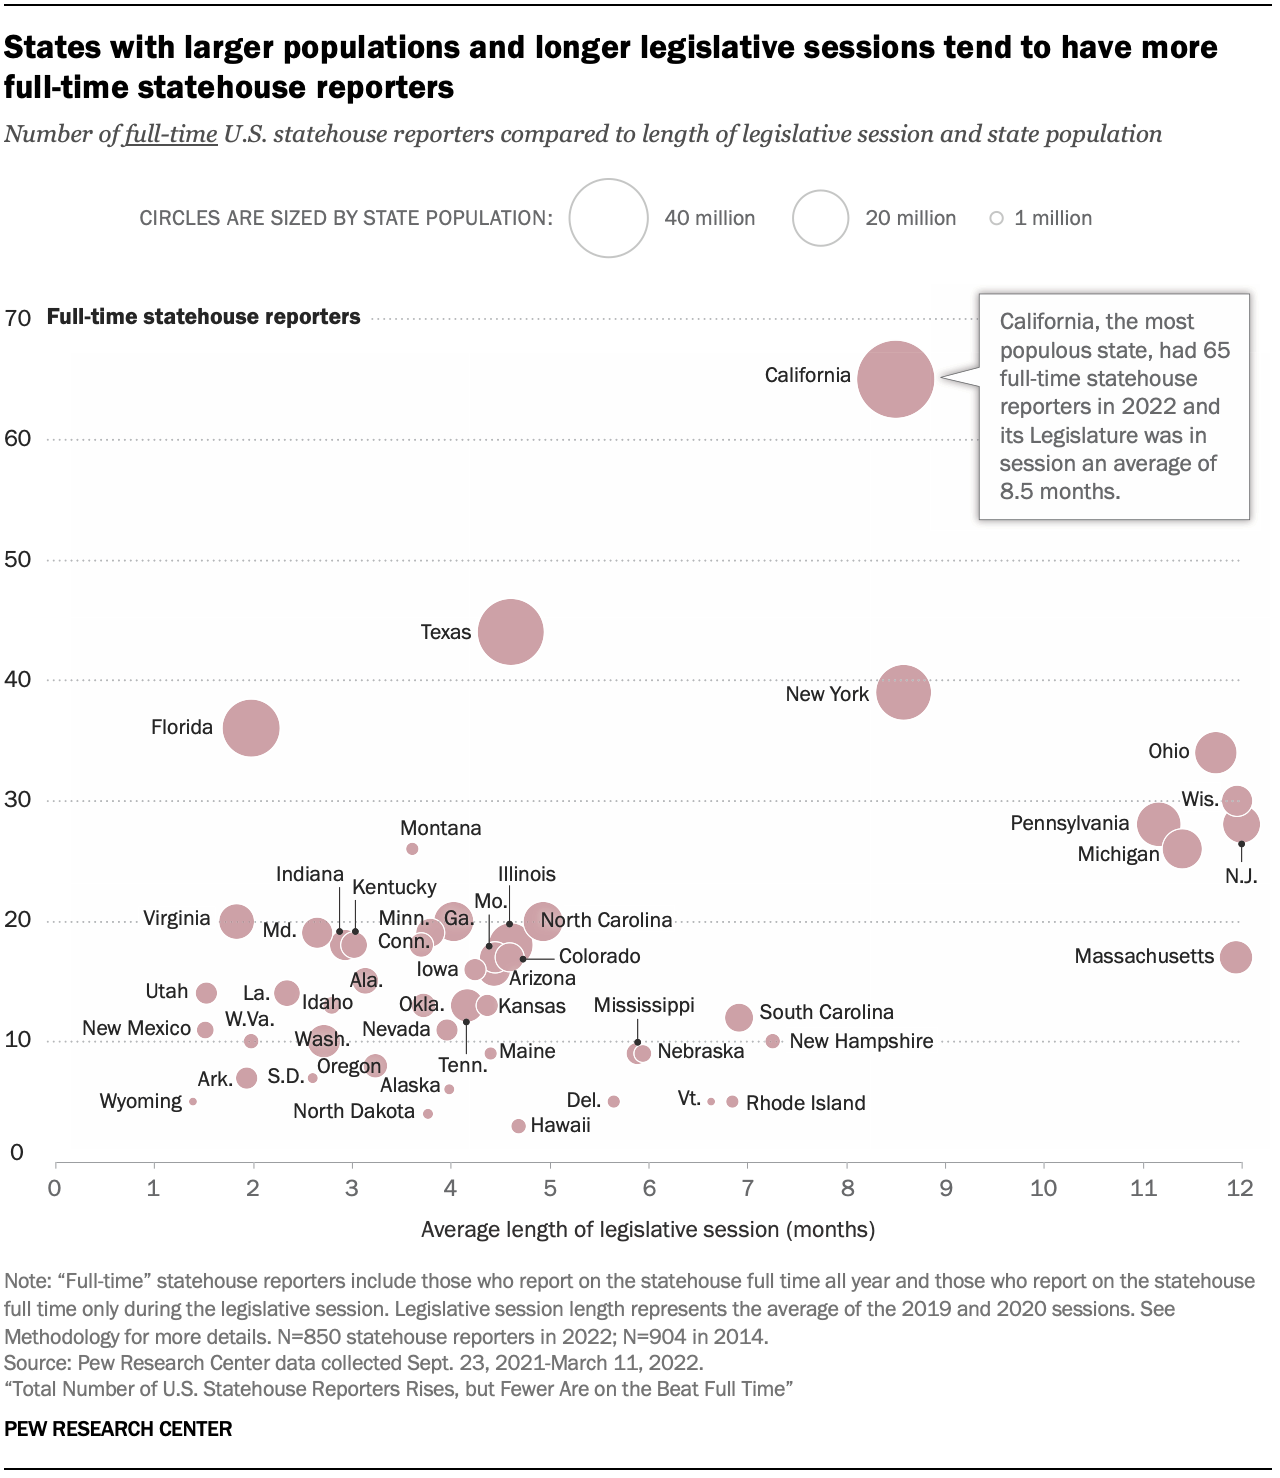
Also similar to 2014, the length of time a state legislature spends in session is related to the number of full-time statehouse reporters in that state. States with longer average legislative sessions tend to have a greater number of full-time statehouse reporters, while states with shorter average session lengths tend to have fewer.8
Of the 10 states with the longest average legislative sessions, seven are among those with the 10 largest full-time statehouse press corps.
The relationship between session length and the number of full-time statehouse reporters, however, is not as strong as the population relationship.9 Florida, for example, has one of the shortest legislative session lengths, at an average of about two months, but it has the fourth-largest full-time statehouse press corps. This might be explained by Florida’s large population, as well as other factors.
U.S. statehouse reporters by state
| State | Full-time (incl. session-only) | Part-time | Students/ interns | Other | Total | Avg. legis. session (months) | Population (2020) |
|---|---|---|---|---|---|---|---|
| Alabama | 15 | 4 | 2 | 21 | 3.14 | 5,024,279 | |
| Alaska | 6 | 6 | 3.98 | 733,391 | |||
| Arizona | 16 | 15 | 7 | 38 | 4.44 | 7,151,502 | |
| Arkansas | 7 | 11 | 18 | 1.94 | 3,011,524 | ||
| California | 65 | 24 | 5 | 16 | 110 | 8.50 | 39,538,223 |
| Colorado | 17 | 12 | 1 | 30 | 4.60 | 5,773,714 | |
| Connecticut | 18 | 8 | 26 | 3.70 | 3,605,944 | ||
| Delaware | 5 | 6 | 11 | 5.65 | 989,948 | ||
| Florida | 36 | 8 | 1 | 7 | 52 | 1.98 | 21,538,187 |
| Georgia | 20 | 17 | 2 | 4 | 43 | 4.03 | 10,711,908 |
| Hawaii | 3 | 9 | 1 | 3 | 16 | 4.69 | 1,455,271 |
| Idaho | 13 | 15 | 28 | 2.80 | 1,839,106 | ||
| Illinois | 18 | 11 | 6 | 1 | 36 | 4.61 | 12,812,508 |
| Indiana | 18 | 6 | 7 | 31 | 2.93 | 6,785,528 | |
| Iowa | 16 | 10 | 26 | 4.25 | 3,190,369 | ||
| Kansas | 13 | 8 | 4 | 1 | 26 | 4.37 | 2,937,880 |
| Kentucky | 18 | 11 | 10 | 3 | 42 | 3.02 | 4,505,836 |
| Louisiana | 14 | 14 | 11 | 3 | 42 | 2.34 | 4,657,757 |
| Maine | 9 | 10 | 19 | 4.40 | 1,362,359 | ||
| Maryland | 19 | 10 | 10 | 1 | 40 | 2.65 | 6,177,224 |
| Massachusetts | 17 | 13 | 11 | 2 | 43 | 11.94 | 7,029,917 |
| Michigan | 26 | 14 | 9 | 3 | 52 | 11.40 | 10,077,331 |
| Minnesota | 19 | 13 | 7 | 7 | 46 | 3.79 | 5,706,494 |
| Mississippi | 9 | 4 | 13 | 5.89 | 2,961,279 | ||
| Missouri | 17 | 8 | 26 | 51 | 4.45 | 6,154,913 | |
| Montana | 26 | 9 | 2 | 2 | 39 | 3.61 | 1,084,225 |
| Nebraska | 9 | 19 | 3 | 1 | 32 | 5.94 | 1,961,504 |
| Nevada | 11 | 13 | 7 | 31 | 3.96 | 3,104,614 | |
| New Hampshire | 10 | 9 | 1 | 20 | 7.26 | 1,377,529 | |
| New Jersey | 28 | 10 | 1 | 39 | 12.00 | 9,288,994 | |
| New Mexico | 11 | 40 | 4 | 55 | 1.52 | 2,117,522 | |
| New York | 39 | 31 | 1 | 71 | 8.58 | 20,201,249 | |
| North Carolina | 20 | 31 | 3 | 54 | 4.94 | 10,439,388 | |
| North Dakota | 4 | 6 | 10 | 3.77 | 779,094 | ||
| Ohio | 34 | 13 | 10 | 1 | 58 | 11.74 | 11,799,448 |
| Oklahoma | 13 | 17 | 2 | 32 | 3.72 | 3,959,353 | |
| Oregon | 8 | 19 | 1 | 28 | 3.24 | 4,237,256 | |
| Pennsylvania | 28 | 10 | 9 | 47 | 11.16 | 13,002,700 | |
| Rhode Island | 5 | 12 | 10 | 27 | 6.85 | 1,097,379 | |
| South Carolina | 12 | 8 | 20 | 6.92 | 5,118,425 | ||
| South Dakota | 7 | 5 | 2 | 14 | 2.60 | 886,667 | |
| Tennessee | 13 | 13 | 1 | 27 | 4.17 | 6,910,840 | |
| Texas | 44 | 18 | 12 | 4 | 78 | 4.61 | 29,145,505 |
| Utah | 14 | 24 | 3 | 41 | 1.53 | 3,271,616 | |
| Vermont | 5 | 17 | 22 | 6.63 | 643,077 | ||
| Virginia | 20 | 13 | 11 | 44 | 1.83 | 8,631,393 | |
| Washington | 10 | 5 | 2 | 17 | 2.72 | 7,705,281 | |
| West Virginia | 10 | 14 | 10 | 34 | 1.98 | 1,793,716 | |
| Wisconsin | 30 | 8 | 2 | 40 | 11.95 | 5,893,718 | |
| Wyoming | 5 | 5 | 1 | 11 | 1.39 | 576,851 |
