
This study examines coverage of the Biden administration on popular Facebook pages during the week of March 8-14, 2021. This complements recent research looking at coverage of the early administration on television, radio and the web across a longer time frame.
This is the latest report in Pew Research Center’s ongoing investigation of the state of news, information and journalism in the digital age, a research program funded by The Pew Charitable Trusts, with generous support from the John S. and James L. Knight Foundation.
Data collection
Posts about the Biden administration were collected from CrowdTangle, a public insights tool owned and operated by Facebook. CrowdTangle gives academic and other researchers access to public posts in their database that match keywords that the researcher supplies in their query.
Researchers developed the list of public pages and posts to study using a multistep process.
Page selection
To determine which public pages to include in this analysis, researchers first conducted a keyword search for the term “Biden” across the first three months of 2021 across all public pages in the CrowdTangle database. After removing posts that had a total view count of zero (i.e., were never viewed), this resulted in roughly 11,510 unique pages (although 11,510 pages were found, the number may change slightly as pages become private or otherwise stop being available).
Researchers then uploaded this list to CrowdTangle in order to use the service’s Leaderboard tool to retrieve the total monthly interactions for each page in the list. The total monthly interactions for October, November and December 2020 were averaged for each page to identify the pages with the highest average monthly interactions across these months (the same time period used to identify outlets in the recent research that looked at news coverage on other platforms).
Researchers first examined the 100 pages with the highest average monthly interactions. We removed pages that were based outside the United States, were already studied in the most recent report about coverage on TV, radio and web outlets, or did not have a clear current affairs focus. In the end, this analysis is based on the top 25 pages according to average monthly interactions, which were a mix of pages from political actors and organizations, commentators, and news outlets. The Facebook pages studied were:
- Barack Obama
- Being Liberal
- Ben Shapiro
- Call To Activism
- Dan Bongino
- David J Harris Jr.
- Dinesh D’Souza
- Donald Trump Jr.
- ForAmerica
- Forbes
- Glenn Beck
- Michael Knowles
- NowThis
- NowThis Politics
- Occupy Democrats
- Ridin’ With Biden
- Robert Reich
- Team Trump
- The Daily Caller
- The Democratic Coalition
- The Other 98%
- The Western Journal
- Trending World by The Epoch Times
- Turning Point USA
- Washington Press
Post selection
All posts from these 25 pages from the time period March 8-14, 2021, were considered for this analysis, for a total of 5,458 posts. Each post was analyzed by trained human coders to determine if it was about the administration. Only the post message and embedded image, link headline and image, and the first 10 minutes of any video embedded in the post were used to make this determination. A total of 1,226 posts met these criteria and formed the basis of this study.
Content analysis
This study conducted a content analysis on two levels: at the page level, the ideological orientation of the page as it describes itself; and at the post level, a series of variables that help characterize the coverage of the administration.
The 25 pages were coded for one variable:
- Ideology refers to a page’s self-described ideology or partisanship as stated on the page’s “about” section, associated websites and social media profiles, or interviews with the subject (if the page is for an individual) or organization (if the page is for an outlet or other organization). The following criteria were used:
- Liberal, including Democrats, progressives, left-leaning, and opposed to conservatives or Republicans
- Conservative, including Republicans, right-leaning, and opposed to liberals or Democrats
- Neither, or no self-described ideology.
Five human coders examined these posts and coded them for four variables, which are largely similar to those in the recent study about news coverage of the Biden administration. In conducting this analysis, only the post message (including any embedded posts) and embedded image, link headline and image, and the first 10 minutes of any video embedded in the post were considered. Because the same variables, protocols and coders were used for this study as the most recent one and content analysis was conducted soon after it was completed for that study, an additional round of intercoder reliability was not performed (see here for previous intercoder reliability estimates). However, to ensure consistency, coders underwent an additional training in order to be refreshed on all the rules and familiarize themselves with the format of the Facebook post.
The 1,226 posts from these pages were coded for the following four variables:
- Topic refers to the general subject matter of the story. For every post, each statement was assigned a topic, and the overall topic assigned to the post was the one that was the most common. For many posts, there was just a single statement. There were a total of 47 different topics, which are grouped below into the three broad topic categories used throughout the analysis – domestic issues, foreign affairs issues and personal/political issues:
- Domestic issues – Abortion/family planning, agriculture, budget/taxes, business/economy, campaign finance, crime incident or trends, crime/gun policy, culture/arts, defense (U.S. domestic), disasters, education, election process, environment, health care, immigration, labor, poverty, religion, science/technology, women’s rights, Social Security, energy, news media, racial justice, LGBTQ+, other civil liberties/civil rights broadly, social media, made-up information/conspiracy – QAnon specifically, other made-up information/conspiracy, refusal to accept Biden administration, other domestic issues
- Foreign affairs – Foreign trade, Iraq/Afghanistan generally, Iran, China, Russia, North Korea, European Union/NATO, United Kingdom, Israel/Palestine, international terrorism, other foreign issues
- President’s management and political approach – Personal profile/character, appointments/nominations, political skills, political philosophy/ideology
- Other
- Assessment of the Biden administration refers to a post’s overall tone toward the president and the administration’s actions or words. Each statement in a post was analyzed to determine whether it carried a positive, negative or neither positive nor negative assessment of the president and his administration. Within a post, there needed to be at least twice as many positive as negative statements for a story to be considered positive, and vice versa to be considered negative, unless there were fewer than three statements in the post, in which case a majority was sufficient. Posts that did not meet these criteria were coded as neither positive nor negative.
- COVID-19 mention refers to whether COVID-19 was mentioned at all in the post text, image or video.
- Trump mention: Each post was analyzed for whether former President Donald Trump was mentioned at all in the post text, image or video. This includes all mentions of him, but not of other individuals such as his family members and former administration members or of references to his administration broadly.
An additional variable, linked source, was analyzed using a custom Python script, and refers to the domain that was linked to in the post.
These 1,226 posts were examined for each of these variables and compared with the 228 stories from the main study that were published during the same time period.
The American Trends Panel survey methodology
Overview
The American Trends Panel (ATP), created by Pew Research Center, is a nationally representative panel of randomly selected U.S. adults. Panelists participate via self-administered web surveys. Panelists who do not have internet access at home are provided with a tablet and wireless internet connection. Interviews are conducted in both English and Spanish. The panel is being managed by Ipsos.
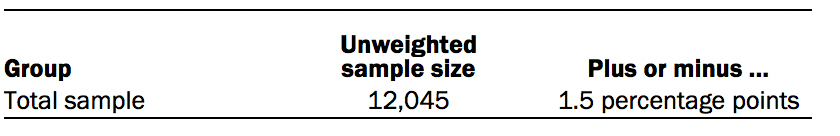
Data in this report is drawn from the panel wave conducted March 8 to March 14, 2021. A total of 12,045 panelists responded out of 13,540 who were sampled, for a response rate of 89%. This does not include five panelists who were removed from the data due to extremely high rates of refusal or straightlining. The cumulative response rate accounting for nonresponse to the recruitment surveys and attrition is 4%. The break-off rate among panelists who logged on to the survey and completed at least one item is 1%. The margin of sampling error for the full sample of 12,045 respondents is plus or minus 1.5 percentage points.
This is the latest report in Pew Research Center’s ongoing investigation of the state of news, information and journalism in the digital age, a research program funded by The Pew Charitable Trusts, with generous support from the John S. and James L. Knight Foundation.
Panel recruitment
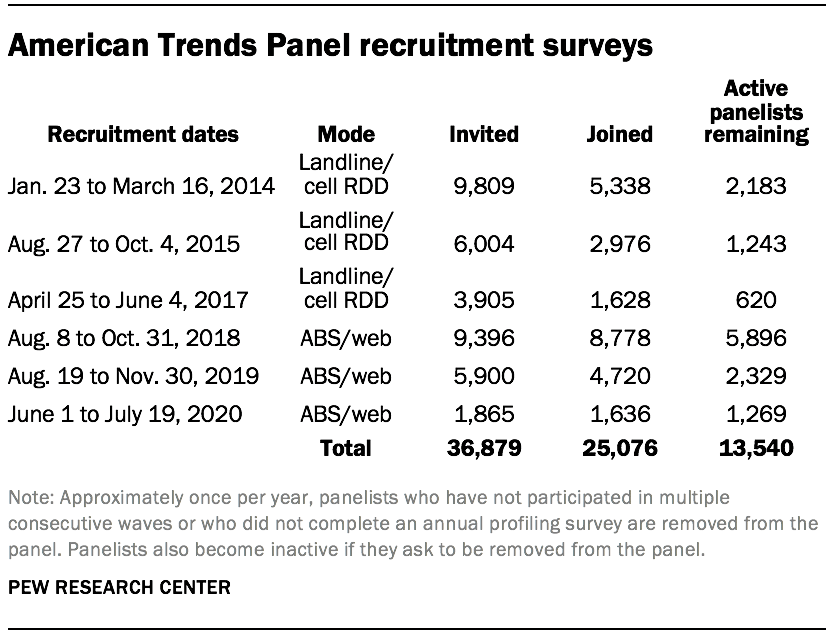
The ATP was created in 2014, with the first cohort of panelists invited to join the panel at the end of a large, national, landline and cellphone random-digit-dial survey that was conducted in both English and Spanish. Two additional recruitments were conducted using the same method in 2015 and 2017, respectively. Across these three surveys, a total of 19,718 adults were invited to join the ATP, of whom 9,942 (50%) agreed to participate.
In August 2018, the ATP switched from telephone to address-based recruitment. Invitations were sent to a random, address-based sample of households selected from the U.S. Postal Service’s Delivery Sequence File. Two additional recruitments were conducted using the same method in 2019 and 2020, respectively. Across these three address-based recruitments, a total of 17,161 adults were invited to join the ATP, of whom 15,134 (88%) agreed to join the panel and completed an initial profile survey. In each household, the adult with the next birthday was asked to go online to complete a survey, at the end of which they were invited to join the panel. Of the 25,076 individuals who have ever joined the ATP, 13,540 remained active panelists and continued to receive survey invitations at the time this survey was conducted.
The U.S. Postal Service’s Delivery Sequence File has been estimated to cover as much as 98% of the population, although some studies suggest that the coverage could be in the low 90% range.1The American Trends Panel never uses breakout routers or chains that direct respondents to additional surveys.
Sample design
The overall target population for this survey was non-institutionalized persons ages 18 and older, living in the U.S., including Alaska and Hawaii.
Questionnaire development and testing
The questionnaire was developed by Pew Research Center in consultation with Ipsos. The web program was rigorously tested on both PC and mobile devices by the Ipsos project management team and Pew Research Center researchers. The Ipsos project management team also populated test data which was analyzed in SPSS to ensure the logic and randomizations were working as intended before launching the survey.
Incentives
All respondents were offered a post-paid incentive for their participation. Respondents could choose to receive the post-paid incentive in the form of a check or a gift code to Amazon.com or could choose to decline the incentive. Incentive amounts ranged from $5 to $20 depending on whether the respondent belongs to a part of the population that is harder or easier to reach. Differential incentive amounts were designed to increase panel survey participation among groups that traditionally have low survey response propensities.
Data collection protocol
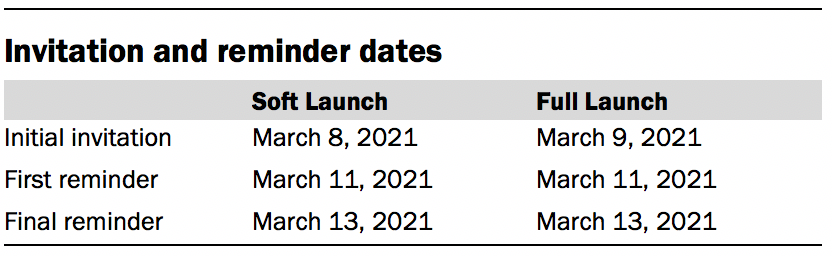
The data collection field period for this survey was March 8 to 14, 2021. Postcard notifications were mailed to all ATP panelists with a known residential address on March 8, 2021.
On March 8 and March 9, invitations were sent out in two separate launches: Soft Launch and Full Launch. Sixty panelists were included in the soft launch, which began with an initial invitation sent on March 8. The ATP panelists chosen for the initial soft launch were known responders who had completed previous ATP surveys within one day of receiving their invitation. All remaining English- and Spanish-speaking panelists were included in the full launch and were sent an invitation on March 9.
All panelists with an email address received an email invitation and up to two email reminders if they did not respond to the survey. All ATP panelists that consented to SMS messages received an SMS invitation and up to two SMS reminders.
Data quality checks
To ensure high-quality data, the Center’s researchers performed data quality checks to identify any respondents showing clear patterns of satisficing. This includes checking for very high rates of leaving questions blank, as well as always selecting the first or last answer presented. As a result of this checking, five ATP respondents were removed from the survey dataset prior to weighting and analysis.
Weighting
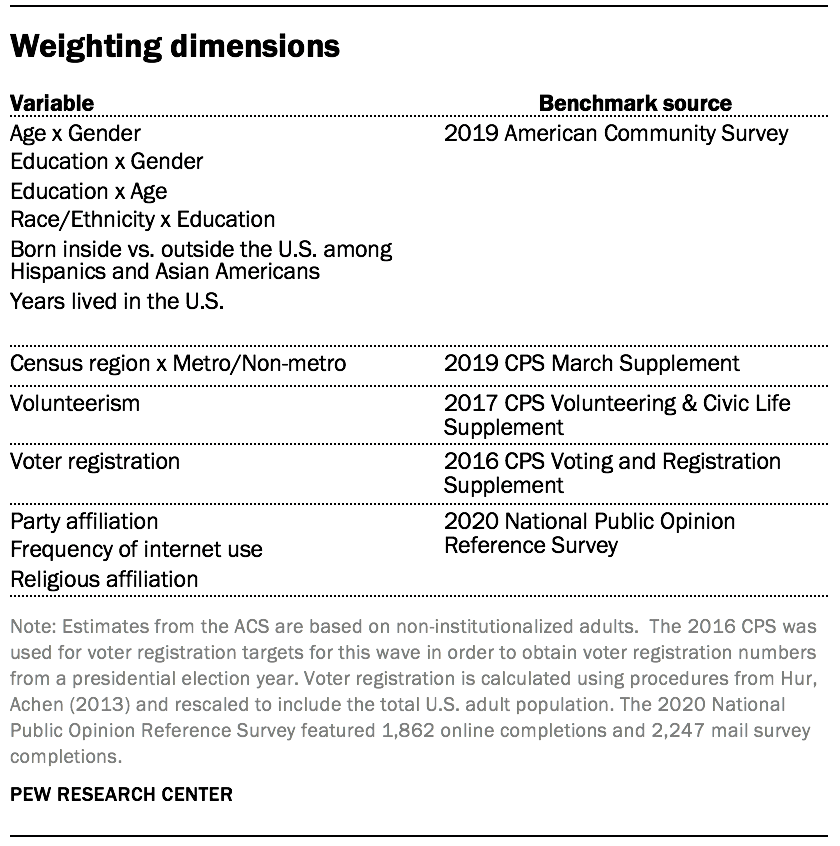
The ATP data was weighted in a multistep process that accounts for multiple stages of sampling and nonresponse that occur at different points in the survey process. First, each panelist begins with a base weight that reflects their probability of selection for their initial recruitment survey (and the probability of being invited to participate in the panel in cases where only a subsample of respondents were invited). The base weights for panelists recruited in different years are scaled to be proportionate to the effective sample size for all active panelists in their cohort. To correct for nonresponse to the initial recruitment surveys and gradual panel attrition, the base weights for all active panelists are calibrated to align with the population benchmarks identified in the accompanying table to create a full-panel weight.
For ATP waves in which only a subsample of panelists are invited to participate, a wave-specific base weight is created by adjusting the full-panel weights for subsampled panelists to account for any differential probabilities of selection for the particular panel wave. For waves in which all active panelists are invited to participate, the wave-specific base weight is identical to the full-panel weight.
In the final weighting step, the wave-specific base weights for panelists who completed the survey are again calibrated to match the population benchmarks specified above. These weights are trimmed (typically at about the 1st and 99th percentiles) to reduce the loss in precision stemming from variance in the weights. Sampling errors and test of statistical significance take into account the effect of weighting.
The following table shows the unweighted sample sizes and the error attributable to sampling that would be expected at the 95% level of confidence for different groups in the survey.
Sample sizes and sampling errors for other subgroups are available upon request. In addition to sampling error, one should bear in mind that question wording and practical difficulties in conducting surveys can introduce error or bias into the findings of opinion polls.


