
The data used in this report were collected from 12,256 members of Pew Research Center’s American Trends Panel (ATP) who participated in at least one of seven surveys conducted between February 2018 and July 2019. The specific survey waves and links to their detailed methodologies are listed in the table below. This report was made possible by The Pew Charitable Trusts, which received support from the John S. and James L. Knight Foundation.
About the American Trends Panel
The ATP is a nationally representative panel of randomly selected U.S. adults. Panelists participate via self-administered web surveys. Panelists who do not have internet access at home are provided with a tablet and wireless internet connection. The panel is being managed by Ipsos.
[chart id=”76548″]
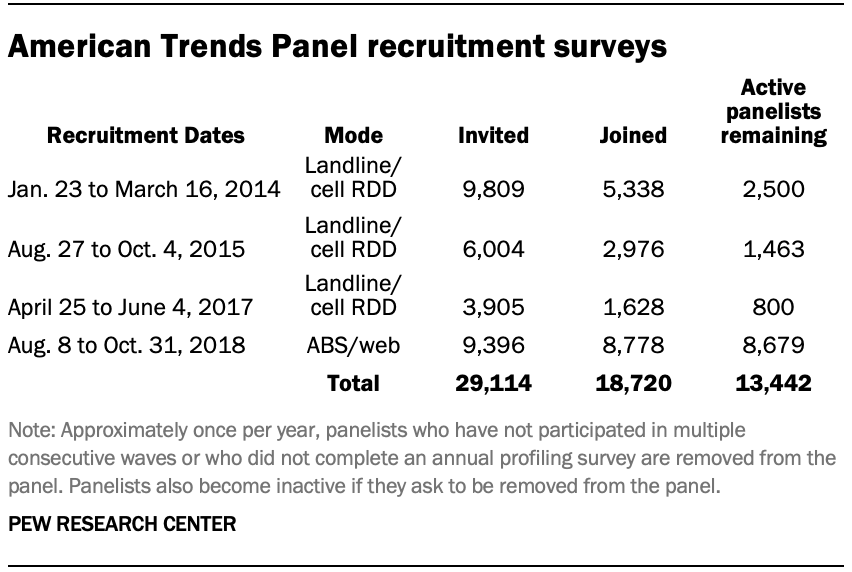
The ATP was created in 2014, with the first cohort of panelists invited to join the panel at the end of a large, national, landline and cellphone random-digit-dial survey that was conducted in both English and Spanish. Two additional recruitments were conducted using the same method in 2015 and 2017, respectively. Across these three surveys, a total of 19,718 adults were invited to join the ATP, of which 9,942 agreed to participate.
In August 2018, the ATP switched from telephone to address-based recruitment. Invitations were sent to a random, address-based sample (ABS) of households selected from the U.S. Postal Service’s Delivery Sequence File. In each household, the adult with the next birthday was asked to go online to complete a survey, at the end of which they were invited to join the panel. For a random half-sample of invitations, households without internet access were instructed to return a postcard. These households were contacted by telephone and sent a tablet if they agreed to participate. A total of 9,396 were invited to join the panel, and 8,778 agreed to join the panel and completed an initial profile survey. Of the 18,720 individuals who had ever joined the ATP, 13,442 remained active panelists and continued to receive survey invitations at the time wave 51 (the last wave used in this report) was conducted.
The U.S. Postal Service’s Delivery Sequence File has been estimated to cover as much as 98% of the population, although some studies suggest that the coverage could be in the low 90% range.7
Weighting
The analyses in this report were performed using survey weights that account for each respondent’s initial probability of selection into the panel and are calibrated to align the sample with population benchmarks. The weights used in each analysis varied depending on which wave or waves were included. For analyses that relied only on questions taken from a single survey wave, the original weights created for that wave were used. Details on the creation of these single-wave weights can be found in each survey’s methodological appendix.
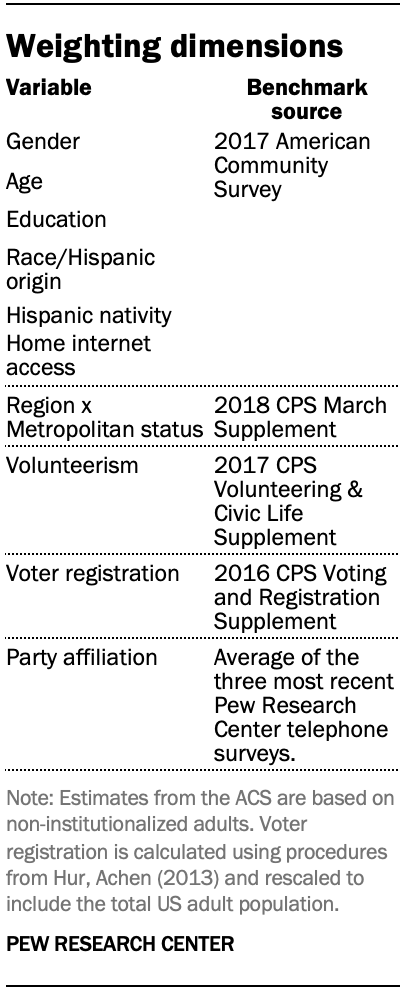
For analyses that combined data from two waves, custom weights were created for the subset of panelists who participated in both waves. New weights were created for all 28 pairs of surveys that were analyzed in the report. All of these weights used the same set of population benchmarks listed in the accompanying table. Likewise, they were all created using the variables that were measured on the 2018 annual profile survey that fielded from August through October 2018. This was done both to ensure a degree of consistency across analyses and to limit the complexity of the weighting process.
Imputation of weighting variables
Some of the analyses in this report involve pairs of waves where both surveys were conducted prior to the 2018 profile survey. In these instances, there are some panelists who completed both surveys but subsequently dropped out of the panel prior to the 2018 profile survey. A total of 290 cases (2%) fell into this category.
For these cases, their previously measured weighting variables were updated to reflect what they likely would have said if they had stayed in the panel and taken the 2018 profile survey.
Weighting variables were updated in one of two ways. For variables that generally do not change (sex, race/ethnicity, Hispanic nativity, year of birth), values were carried forward from the most recent profile survey that the respondent had completed. For variables for which change over time is more likely (education, metropolitan status, census region, voter registration and party affiliation), an iterative procedure known as imputation by chained equations was used to fill in missing values.8
To fill in a missing value for a given case, the procedure as applied here first finds cases who matched on the variable to be imputed in the previous profile survey and gave similar answers to the rest of the questions used in weighting. Then the missing value is replaced with a copy of the value from a randomly selected donor. For example, to impute the education variable for a case that previously indicated they had a high school degree or less, the imputed value is copied from a case that had also indicated a high school or less education and matched on several of the other weighting variables. The process is performed separately for each variable and repeated many times until the distribution of imputed values stabilizes. The procedure ensures that the imputed values are plausible for each respondent while also reflecting the level of change that would naturally occur in the population.
Sampling errors and test of statistical significance take into account the effect of weighting. Interviews are conducted in both English and Spanish, but the American Trends Panel’s Hispanic sample is predominantly U.S. born and English speaking.
In addition to sampling error, one should bear in mind that question wording and practical difficulties in conducting surveys can introduce error or bias into the findings of opinion polls.
The following table shows the unweighted sample sizes and the error attributable to sampling that would be expected at the 95% level of confidence for different groups in the survey:
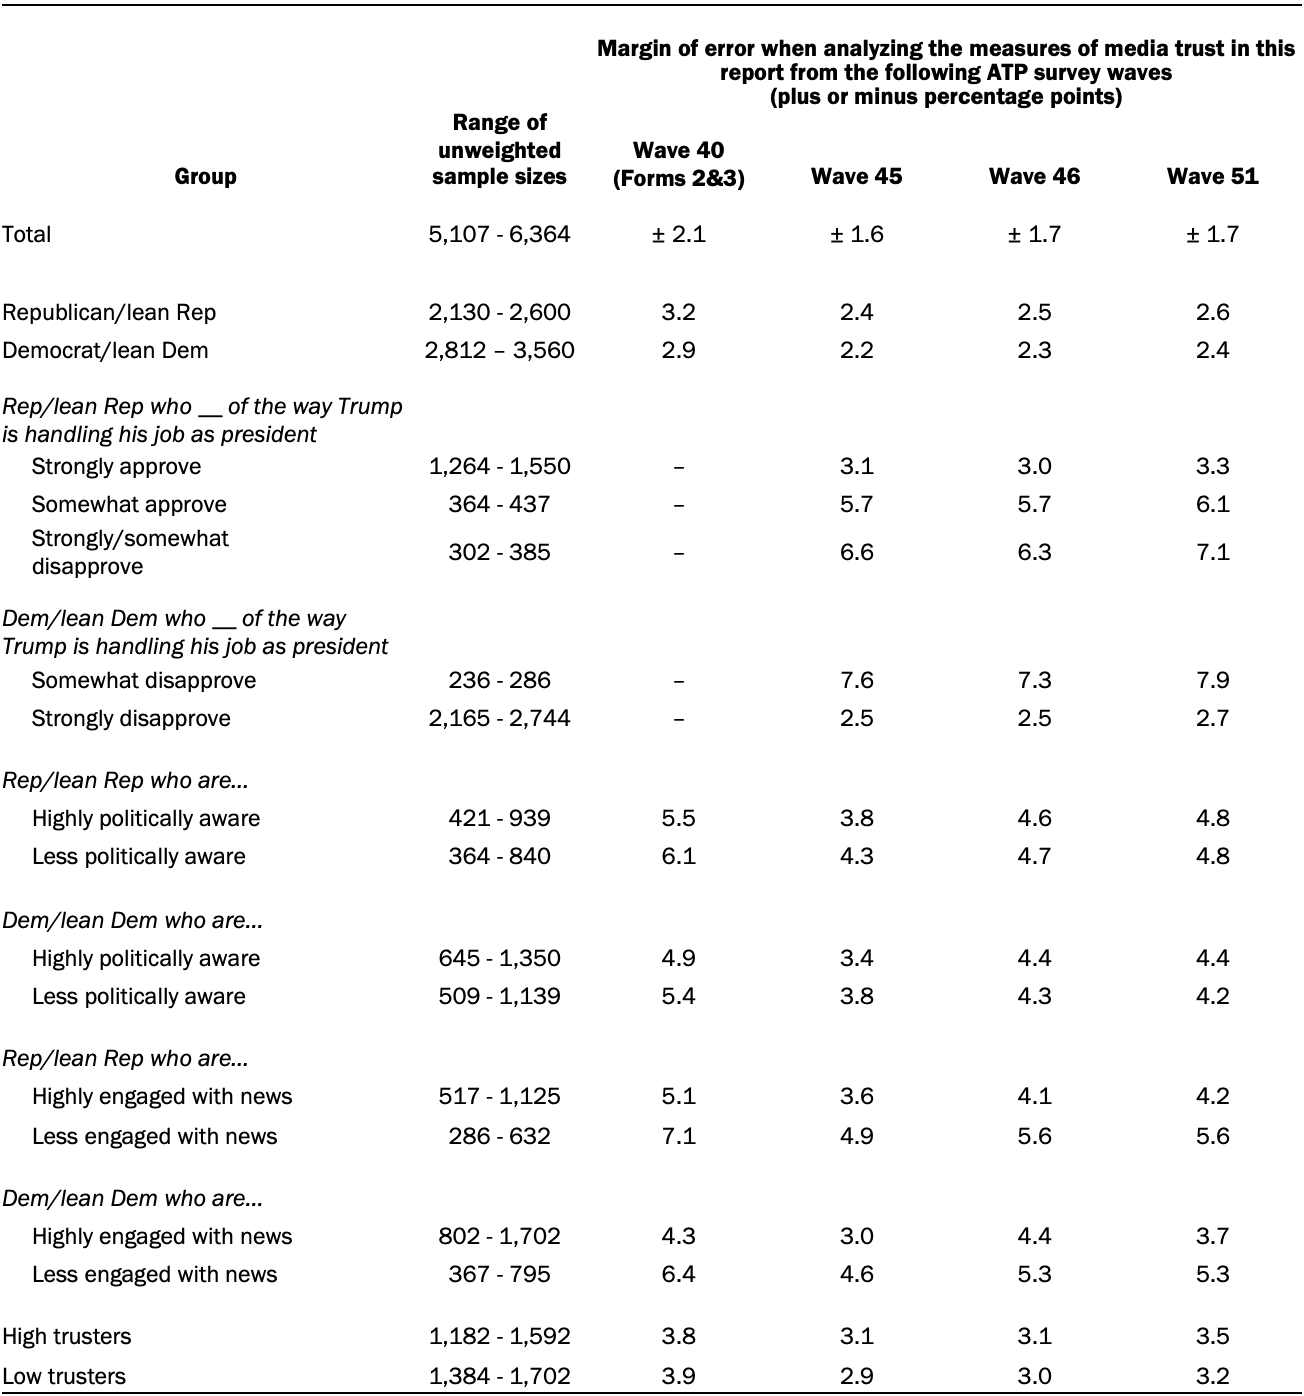
Sample sizes and sampling errors for other subgroups are available upon request.
Determining the variables included in the analysis
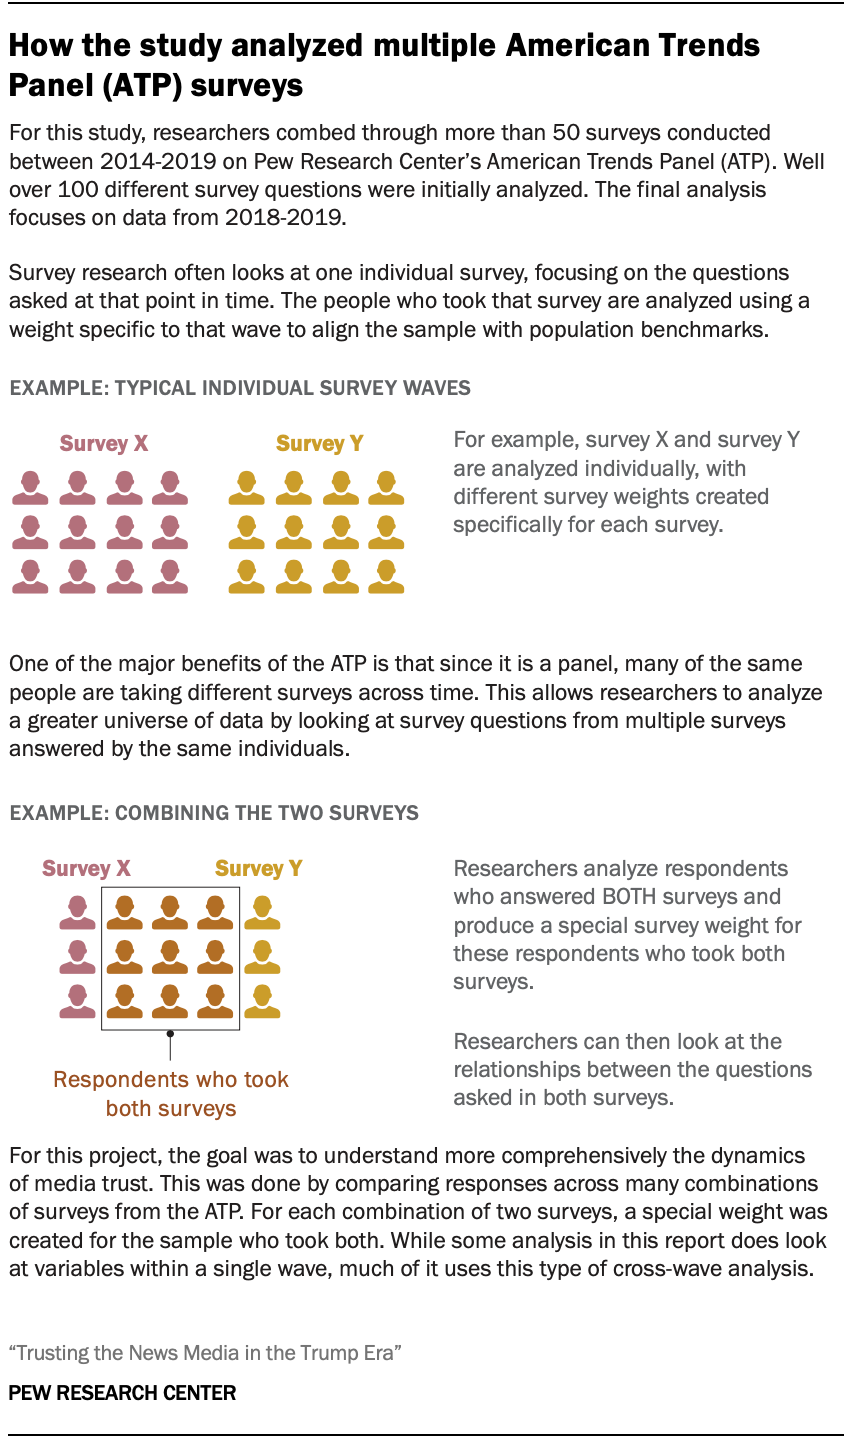
The purpose of this study was to integrate data from multiple surveys to develop a comprehensive understanding of what factors connect to the public’s trust in the news media. Researchers reviewed more than 50 surveys fielded on the ATP between 2014 and 2019 to identify measures related to the public’s trust in the news media as well as factors that influence these evaluations. Data from well over 100 questions were considered for inclusion in this study, with the focus of the final analysis on measures collected from seven surveys fielded between February 2018 and July 2019.
The dependent and explanatory variables included in the analysis were largely determined by previous Pew Research Center research as well as existing literature around trust in the news media. Dependent variables either directly measured trust (e.g., level of trust in the information from national news organizations) or other closely related concepts (e.g., level of confidence that journalists will act in the best interests of the public). Additionally, a wide range of explanatory variables were considered for inclusion in the analysis (e.g., approval of Trump’s job performance, engagement with politics and the news, and being trusting of others). Researchers examined the explanatory variables to assess their connections to the public’s trust in the news media to determine which would be included in the final analysis.
Several criteria were considered before variables were included in the final analysis. Variables without a large and robust enough sample size to analyze across waves or those with very skewed distributions were eliminated from consideration. If two questions measured similar concepts, preference was given to the one included on the most recent survey and/or had the larger sample size. For explanatory factors, if there were similar measures across waves, the one that were measured closest in time to the dependent measures was typically included in the analysis. Also, if a variable didn’t adequately represent the desired concept, it was no longer considered. Finally, to ensure that these data shed light on current attitudes, researchers also decided to focus on data from more recent years. All the variables used in the analysis are from ATP surveys fielded in 2018 and 2019.
Once the list of dependent and explanatory variables was finalized, researchers examined the connection between the explanatory variables with media trust using crosstabulations and multivariate regression models. Depending on the measure being considered, many of these models controlled for demographic characteristics like age and education as well as party identification. The dependent variables used in the final report include:
- Trust in information from national news organizations
- Views of journalists’ ethical standards
- Confidence that journalists will act in the best interests of the public
- Views of the news media’s watchdog role
- Perceived fairness of news coverage
- Loyalty to news sources
The independent variables included in this report to test the connection with media trust include the following:
- Political party identification
- Approval for the way Trump is handling his job as president
- Political awareness
- Engagement with news
- Whether or not one is trusting of others
- Preferred pathway for news
- Life satisfaction
- Happiness with one’s life
- Living in the community where one grew up
- Perception of current financial situation
- Perception of future financial situation
- A range of demographic characteristics, including age, race and ethnicity, education, income, urban-suburban-rural residency, religion, marital status, home ownership and having kids.
For a list of specific questions and variables used for each of these concepts, the original topline, and the dates that they were asked please see the table below.
[chart id=”76556″]
