

The three low engagement groups in our typology—Not For Me, Young and Restless, and Rooted and Roadblocked—fall at the farthest end of the spectrum of library users. Unlike members of the medium engagement groups, who generally report being moderately active in their library habits, only about a third of the low engagement users have used a public library in any form in the past year. However, those in the low engagement groups have used a library at some point in their lives, which sets them apart from the non-engagement groups (who have no personal library experience).
These three groups are relatively small, together accounting for less than 20% of the U.S. population. They are also some of the most interesting groups in the typology because they are relatively distinct in their habits and views.
Members of these three groups generally share a lack of personal engagement with their local libraries, as well as a general familiarity with library services. A majority of all three groups say they know “not much” or “nothing at all” about the services at their local public library. However, the context of their low library engagement varies from group to group.
For instance, the Not For Me group is set apart by its negative views of public libraries. In contrast to the other two low engagement groups, they don’t view libraries as particularly important to their communities. In fact, only 56% of the Not For Me group say their library’s closing would have any impact on their community, compared with 85% of the other two low engagement groups and 90% of the general population. This group includes a somewhat higher proportion of men, and its respondents are often older (as a group, the a median age is 46). Members of this group also tend to have lower levels of education, with just 18% having graduated college.
As the name of the second low engagement group implies, the Young and Restless tend to be both younger and more transient: Alost three-quarters (73%) are under the age of 50 (their median age is 33), and most say they have lived in their current neighborhood five years or fewer. This might help account for the fact that fewer than one in six (15%) even know where the closest public library is located—a lower proportion than any other group, and the most striking aspect of their current relationship with libraries. However, all have used a library at some point in their lives, and they tend to have positive views of libraries in general; at the moment, however, libraries aren’t a part of their daily lives.

The final low engagement group, Rooted and Roadblocked, stands apart from the others on many measures. Their name comes from the fact that they tend to be longtime residents of their neighborhoods, but in many ways are disengaged from their communities. This is likely related to their age (most are over the age of 50) and various circumstances in their lives: 35% are retired, 27% are living with a disability, and 34% say that they or a loved one had a major illness within the past year. Many say they would need help using newer technologies.

Like the other two low engagement groups, Rooted and Roadblocked respondents tend to have low levels of personal library use—about a third (33%) visited the library in the last 12 months, and only 6% used a library website in that time. However, they are far more likely than the other two low engagement groups to say their library’s closing would majorly impact themselves and their families, as well as on their communities as a whole.
Though many in these low engagement groups are in life stages where they won’t necessarily be pulled into the library by certain life stage-related factors (such as having minor children, having research needs related to college, or exploring training for work), this is not to say that they would have no use for libraries. On the contrary, groups such as Not For Me and Rooted and Roadblocked are less comfortable with newer technologies, tend to have lower levels of education and household income, and are generally more likely to say they would need help finding various types of information; thus while they seem to have many needs that could be met by libraries, they are often less likely to turn to the library for various reasons, such as perceived lack of relevance due to lack of familiarity, or a lack of personal mobility.
Overall, each of the low engagement groups have unique circumstances for their lack of library use, which may point to distinct barriers to engagement. For instance, few Young and Restless respondents are even aware of where their local library is located, but they report having an easier time finding what they’re looking for when the do visit. Meanwhile, the Not For Me respondents are more likely to have difficulty visiting their library, and are often less comfortable navigating libraries in person or online.
Not For Me
Overview
Though accounting for only 4% of the U.S. population, the Not For Me group is striking in its negative perceptions of public libraries, even in comparison with the other two low engagement groups. Unlike the other two low engagement groups, they generally do not view libraries as an important resource for their communities:
- 70% say that people do not need public libraries as much as they used to because they can find most information on their own, compared with 52% of all respondents.
- Only 56% say their library’s closing would have any impact on their community, compared with 85% of the other two low engagement groups and 90% of the general population.
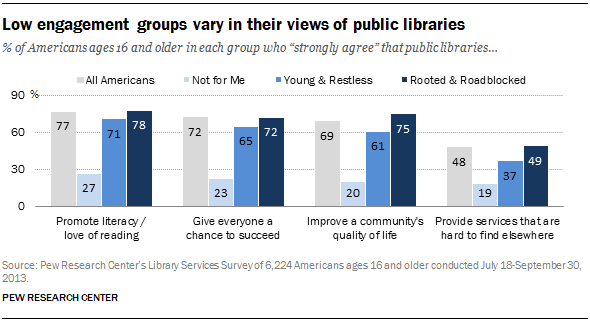
- Just 38% say that having a public library improves the quality of life in a community, compared with 94% of the U.S. population as a whole.
Perhaps related to their lack of interest in libraries, members of the Not for Me group know less about what services are offered, have more difficulty finding things, and are more likely to have had a negative experience at their local public library:
- 39% say it would be “very easy” to visit a public library in person, compared with a majority 62% of the general population.
- 32% say they know nothing at all about the services at their local public library.
- 26% say it would be “very easy” to use a public library website, compared with 47% of the general population.
- 21% have had a negative experience at a library, compared with 9% of all those who have ever used a public library.
Members of this group do not appear to reject libraries because they have lots of technology in their lives and use it for information acquisition, rather than libraries. On the contrary, they tend to have lower rates of technology adoption, particularly internet use, and are less confident navigating several types of information. An important clue to their state of mind about the importance of information is that only 57% of the Not For Me group say that people like them can have an impact on making their community a better place—the second lowest ranking group on that question.
The Not for Me group includes a higher proportion of men, with a slightly older median age of around 46. Members of this group also tend to have lower levels of education than the general population, with fewer than one in five (18%) having graduated college. They are much more likely to have lived in their neighborhood for longer periods, though less active in certain activities in their communities.
Who they are
Demographics
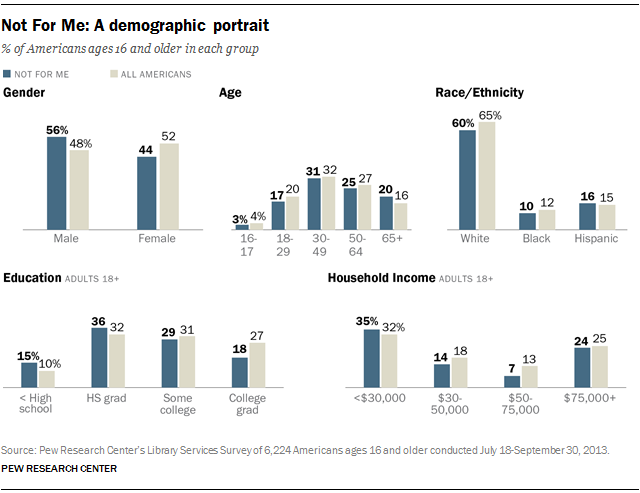
The Not For Me group is often very similar in some demographics to the general population, with some exceptions:
- Gender: Unlike the general population, this group includes a higher proportion of men: 56% are men, compared with 48% of all Americans in our sample.
- Education: Members of this group tend to have lower levels of education, with just 18% having graduated college.
- Age: The Not For Me tend to be slightly older, with a median age of around 46.
Members of this group are also somewhat less likely to be married (41%), and are also a little less likely to be parents (26%) than the general population. They are also a little less likely to be employed full-time (39%), and more likely to be retired (23%).
Other lifestyle notes
In terms of where they live, those in the Not For Me group are in line with the U.S. population as a whole; they can be found in every U.S. region and in every community type, though they are slightly less likely than the general population to live in urban or suburban areas.

Like their fellow low engagement group Rooted and Roadblocked, Not For Me respondents are tend to have lived in their neighborhood for longer periods than other groups: 34% have lived in their current neighborhood for more than 20 years (compared with the national benchmark of 26%), and another 22% have lived there for 11-20 years. Yet they do not feel as positively about their community as some other groups, or feel as empowered to effect change:
- Though most still describe it as an “excellent” or “good” place to live, Not For Me respondents are more likely than many other groups to describe their community as “fair” or “poor”.
- Only 57% think people like them can have even a moderate impact on their community, and a third (34%) think they can only have a small impact or none or at all.

Members of the Not For Me group are less engaged in their communities in terms of activities such as attending sporting events, museums, or concerts. Notably, 45% do not participate in any of these activities regularly at all.
In terms of politics, those in the Not For Me group skews conservative, but also disengaged. They identify as Democrat at about half the national rate (15%, compared with a national benchmark of 31%), but are not necessarily more likely to identify as Republican; rather, they are more likely to not have political identification overall (12%).
Technology and information habits
Members of the Not For Me group have lower levels of technology use in some areas, and are also less likely to read or consume other forms of media regularly. They read an average of 10 books in the past 12 months (a median of 3), significantly fewer than higher engagement groups such as Library Lovers, Information Omnivores, and Print Traditionalists—though these habits are similar to other low engagement groups.
The Not for Me group does not resist library use because they feel self-sufficient. Rather, Not For Me respondents are more likely to say they would need assistance finding various types of information, such as reliable health information.
Technology use
Those in the Not For Me group have somewhat lower rates of technology use than Americans as a whole, particularly internet adoption. Most do go online, but they log on somewhat less often than other internet users—though they are generally as likely as other internet users to use social networking sites or Twitter.

Defining information traits
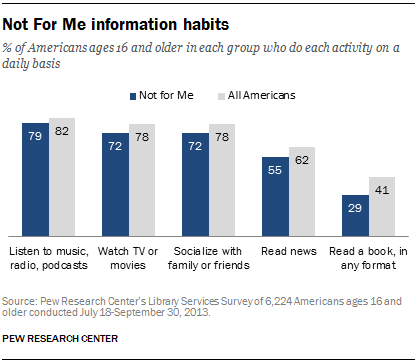
Looking closer at their information habits, we find that Not For Me members are much less likely to report reading a book daily than most other groups, though most say they read the news.
A lack of engagement with reading and books is one of the most striking features of Not For Me respondents’ information habits, and may be a contributing factor to their lower levels of engagement with libraries. For instance, they are less likely to say that they read books on a daily basis, and read an average of 10 books in the past 12 months (a median of 3), significantly fewer than higher engagement groups such as Library Lovers, Information Omnivores, and Print Traditionalists—though these habits are similar to other low engagement groups.
In addition:
- 26% say they go to bookstores regularly, compared with 32% of the general population.
- About half say they purchase most books (50%), in line with the national benchmark, though the Not For Me are slightly less likely to borrow (30%) them. Another 8% say they are just as likely to buy their books as to buy them.
- They are also more likely than the general population to prefer information in audio or visual format to reading text (54%, compared with 49% of all Americans).
Asked a series of questions about their information attitudes and abilities, they are more likely to say it would be difficult to find various types of information, such as reliable health information.

Relationship to public libraries
Public library use and experiences
The Not For Me group’s recent library usage is consistent with that of the other low engagement groups. They are also particularly less likely to have recently used a library website:
- 40% have library cards.
- 31% have visited a library in person in the past year.
- 12% say they have used a library website in the past year.
- 9% say their library use has increased in the past five years; 53% say their library use has stayed about the same, and another 29% say their library use has decreased in that time.
Those in the Not For Me group are much less likely than higher engagement groups to say they would have no problems visiting a library or used a library website if they wanted to: Just 39% say it would be “very easy” to visit a public library in person (compared with the national benchmark of 62%), and 26% say it would be “very easy” to use a public library website (compared with the national benchmark of 47%.) In addition:
- Not for Me respondents are somewhat less likely to say they live within five miles of the nearest library (62%, versus 72% of the general population).
- They are also less likely to say it’s usually easy or very easy for them to find what they’re looking for at the library: 70% say this, compared with 91% of all those who have ever visited a public library in person.
- Altogether, over half say they know “not much” (25%) or “nothing at all” (32%) about the services at their local public library.
Another clue to their low levels of engagement might be that Not For Me respondents have more negative experiences with the libraries they have come into contact with:
- They are the group most likely to say that they have had a negative experience using a public library, at more than twice the national rate: 21% have had a negative experience, compared with 9% of all those who have ever used a public library.
- Among the groups with any personal library experiences, they are the group least likely to say that public libraries are welcoming and friendly places: Just 70% say that, while 16% say libraries are not welcoming.
- Just over half (52%) say their library is a nice, pleasant place to be, lower than the 67% of the general population who say this. Another 20% say it’s an okay space (but needs improvements), and 5% say it needs a lot of improvement; another 18% say they could not give an opinion because they have never been inside their local public library.
Public library attitudes
In general, the Not For Me have much more negative opinions about public libraries than any other group. Not only do they not have a personal relationship with public libraries, they do not view libraries as useful to their communities or even relevant in the digital age. For instance, 70% say that people do not need public libraries as much as they used to because they can find most information on their own; not even half (48%) agree overall that libraries are important because they promote literacy and a love of reading. And just 38% agree that having a public library improves the quality of life in a community, compared with 94% of all Americans.
In addition, many Not For Me members also do not have the familiarity with libraries to give an opinion one way or another. In one example, 31% did not know whether or not libraries do a good job keeping up with new technologies.

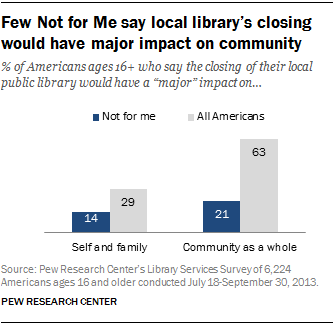
These negative views are reflected further in their overall evaluation of the important of libraries, both to themselves and to their communities. This is illustrated most strikingly by the fact that only one in five (21%) of the Not For Me group say that their local public library’s closing would have a major impact on their community, compared with 63% of the general population. Similarly, just 14% say it would have a “major impact” on them and their family, compared with the 29% of all Americans ages 16 and older who say it would have a major household impact.
Some respondents in this group do say that certain library services are very important to them and their family, but far fewer say this than almost any other group—including at least one of the non-user groups. And almost half (48%) say that none of these services are very important, a significantly higher rate than any other group.

Young and Restless
Overview
On first glance, the Young and Restless group might seem to confirm certain narratives about young people’s perceived lack of engagement with libraries. However, this group does not represent all young people—in fact, young people in general do not have lower rates of library use than older adults, and high engagement groups tend to be younger than the less engaged. Instead, it is the case that this is a group of non-users that tends to be younger. However, Young and Restless group members do tend to have generally positive views of libraries, and some personal experiences with them; they simply are not using public libraries at their current point in life.
Similar to the other low engagement groups, only a third of the members of this group have a library card, and about as many have visited a library in the past year. Most are under the age of 50 (their median age is 33), and they are more urban than most other groups. They also haven’t lived in their neighborhoods very long, which might help account for the fact that fewer than one in five even know where the closest public library is located—far fewer than members of any other group, and the defining feature of their current relationship with libraries. However, all have used a library at some point in their lives, and they tend to have positive views of libraries in general; at the moment, libraries just aren’t on their radar.
Who they are
Demographics
As their name implies, Young and Restless respondents are much more likely to be younger than most other groups. Most are under the age of 50, and their median age is 33. They stand out from the general population in other ways as well:
- Gender: They include a higher proportion of men compared with the general population, as 53% are men and 47% are women.
- Race/ethnicity: This group is also more diverse than most others, as just 56% of its members are white (compared with 65% of the general population).
- Household income: The distribution of their household income more or less reflects that of the general population, although it is a little more divided: 37% are in households earning less than $30,000 per year, but 26% live in households earning at least $75,000 per year—fewer are in the intervening categories.

Other lifestyle notes
Some 36% of the members of this group say they live in large cities, a higher proportion than almost any other group—though many also live in suburbs or small towns. In terms of region, almost half (48%) live in the South, significantly more than almost any other group except for Print Traditionalists and those “Off the Grid.”

As denoted by the second half of their name, they are more transient than other groups. A third have lived in their neighborhood less than a year, and 40% have lived there for one to five years. Perhaps related to their shorter tenure, few (12%) say they know the names of all their neighbors, and 44% say they don’t know any—one of the highest rates in any group.


Young and Restless respondents generally feel positively about their communities, and feel they have the power to effect change. They are also very similar to the overall population in their attendance of most of the activities we asked about.
Politically, they tend to lean a little more moderate or liberal, though their party identification is similar to that of the general population: 32% identify as Democrat, 22% identify as Republican, and 34% identify as independent.
Technology and information habits
The Young and Restless have high rates of technology use overall, particularly when it comes to mobile adoption. However, they do not differ too much from the general population in the broad outlines of their basic daily information and media habits. They like to learn, and are comfortable finding various types of information on their own.
Their overall reading habits are fairly typical, and they read an average of 11 books in the year. At least six in ten (61%) say they purchase most of their books, one of the highest rates among any group. However, it seems they make more of their book purchases online, as they are less likely to visit bookstores in person than the general population.
Technology use
Members of the Young and Restless group are distinguished by their extremely high rates of mobile use: 82% access the internet on a cell phone, tablet, or other mobile device, and 68% own a smartphone specifically. They also have higher rates of social media usage compared with other internet users. However, this group is not necessarily more likely to score highly on all our measures of technology use. Their rates of tablet and e-reader ownership are similar to that of the general population (36% own a tablet, and 24% an e-reader), as are their overall internet and cell phone ownership rates.

Defining information traits

In broad strokes, the Young and Restless do not differ too much from the general population in their basic daily information and media habits. They are a little more likely than the national benchmark to listen to music or the radio on a daily basis, and a little less likely to watch television or movies or read a book that often.
Their overall reading habits are also fairly typical: As a group, the Young and Restless read an average of 11 books in the past 12 months, and a median of 5. Some 16% did not read any books in the previous year, similar to the rate for all Americans. They are also more likely to buy their books: At least six in ten (61%) say they purchase most of their books instead of borrowing them, one of the highest rates of any group. However, like other low and medium engagement groups, they are somewhat less likely to visit bookstores in person than the general population.

Looking closer at their information habits and attitudes, we find that they like to learn new things, and most (80%) say they like having so much information available these days—only 16% say they feel overloaded. They generally feel more confident than many other groups in being able to complete the tasks related to technology, though are a little more likely to need help with tasks such as applying for government services or benefits.
Relationship to public libraries
Public library use and experiences
The basic library habits of the Young and Restless are similar to those of the other two low engagement groups, though they are more likely to make use of library websites:
- 32% have a library card.
- 32% visited a library in person in the past year. Among these recent library visitors, hardly any go to the library every week; 34% go at least once a month, and 62% go less often.
- 25% used a library website in the past year. (About half–50%–have used a library website at some point in their lives.)
- 36% say their library use has increased in the past five years, compared with 25% of the general population.

They generally feel it would be easy to use the library, but are less likely to know much about what resources and services are offered:
- Just 11% know all or most of the services their library offers (compared with 23% of general population), and 32% say they know nothing at all.
- Among those who have ever visited a library in person, most say it would be easy to visit a public library, and only 22% say it would be “very easy.”
The biggest obstacle to their library use might simply be lack of awareness of local offerings: 85% do not know where their closest public library is, compared with 9% of general population. Among the 15% who do know where the nearest library is, most say it is within five miles.
Public library attitudes
Though most have not used a library recently, most Young and Restless respondents have positive views of public libraries and their roles in the community. For instance, 93% say libraries are welcoming places, and 99% overall agree that libraries are important because they promote literacy and a love of reading. They are somewhat less likely to feel that libraries are as essential in other roles in their communities. For instance, just 37% strongly agree that public libraries provide many services people would have a hard time finding elsewhere, compared with the national benchmark of 48%.


Young and Restless respondents are somewhat more likely than all those who have ever visited a public libraryto be ambivalent about the individual libraries they have encountered: They are far less likely to say their local library is a nice, pleasant place to be (29% say this, compared with 67% of all those ages 16 and older). Another 13% say that it was an okay space but could use some improvement, but 51% volunteered that they could not say because they have never been inside their local library.
The Young and Restless differ from the other two low engagement groups in their moderate views towards the importance of libraries in the community. They are similar to Not For Me respondents in that few say their local library’s closing would have a major personal impact; more say that their library’s closing would have a major impact on their community as a whole, but not at the levels of Rooted and Roadblocked respondents.
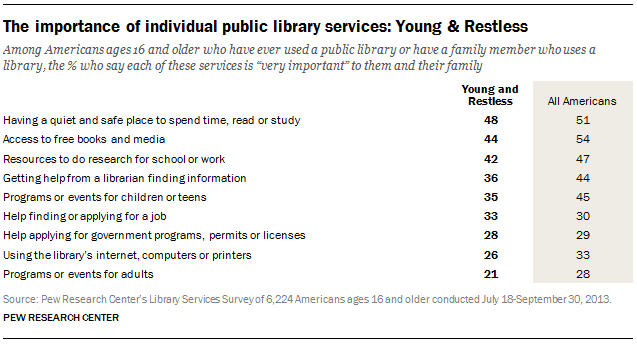
Members of this group are less likely to say that they and their family rely on various individual library services (38% say another member of their household uses the library), though they are more likely than Not For Me respondents to say so. One of the biggest differences is in the importance of libraries’ free books and media: Only 44% say this resource is “very important,” compared with 54% of all respondents with some library exposure. Finally, 35% say that none of these services are very important to them and their family.
Rooted and Roadblocked
Overview
The final low engagement group, Rooted and Roadblocked, represents about 7% of the U.S. population. Their name derives from the fact that they are longtime residents of their neighborhoods, but many have challenging factors in their lives and are less active in certain community activities. They stand out in part due to their age (most are over the age of 50) and various circumstances in their lives: 35% are retired, 27% are living with a disability, and 34% experienced a major illness (either personally or that of a loved one) within the past year.
While they too have low levels of personal library use—33% visited the library in the last 12 months, and only 6% used a library website in that time— Rooted and Roadblocked members are far more likely than other low engagement groups to say their library’s closing would have a major impact on their families and on their communities. Thus, rather than representing a more negative view of libraries, as with the Not For Me group, Rooted and Roadblocked respondents’ low levels of library engagement seem to fit into a broader context of low engagement with certain types of information and similar community activities.
Who they are
Demographics
In terms of age, Rooted and Roadblocked respondents represent one of the oldest groups in the typology: Almost two-thirds (66%) are over the age of 50, and one in three (34%) is over the age of 65; the group’s median age is 58. They stand out in other ways as well:
- Race/ethnicity: This group has a somewhat higher proportion of whites (69%) compared with many other groups, and the U.S. population as a whole.
- Socioeconomic status: Members of this group are also more likely to have lower levels of education (51% of adults in this group did not attend college) and slightly lower household incomes than the general population.

Other lifestyle notes
Rooted and Roadblocked respondents can be found in every region, and in every community type. Some 20% live in big cities, 22% live in the suburbs, 40% live in a small city or town, and 16% live in a rural area.


The first half of the “Rooted and Roadblocked” name stems from the fact that most have lived in their neighborhood for at least 11 years—including the 37% who have lived in their current neighborhood for more than 20 years. However, despite their longer tenure, they are not more likely to know their neighbors’ names than many groups who have lived in their neighborhoods for shorter periods—and 25% don’t know any of their neighbors’ names.
The second half of their name relates to the various roadblocks many of them face in their life circumstances. For instance, like the Not For Me group, they are less likely to feel that they can effect change in their communities: only 62% say they feel they can have at least a moderate impact on their community, and 33% say people they them can only make a small impact or no impact at all. Other circumstances are more likely to affect their lives as well:
- Employment: Rooted and Roadblocked respondents are less likely to be in the workforce, and 35% are retired.
- Health issues: 34% experienced a major illness—either their own, or that of a loved one—within the past year, more than most other groups.
- Living with disability: 27% are living with a disability, a significantly higher proportion than almost any other group.

Perhaps as a result, they are also less engaged in certain community activities, from attending sporting events to visiting museums; over half do not regularly participate in any of the general activities we asked about (though they may be engaged in other community activities not covered in our questions).
Rooted and Roadblocked respondents are fairly typical in their political identification—23% identify as Republican, 29% say they are Democrats, and 32% are Independents—though they are also less likely to have a party affiliation (8%) than many groups. In terms of political ideology, 34% identify as conservative, 36% as moderate, and 17% as liberal, making them less likely to identify as liberal than the general population.
Technology and information habits
Members of this group are less likely than most other groups to own or use new technologies, particularly mobile technologies. However, most do go online, and many have tablets (24%) or e-readers (20%). Most of them watch television on a daily basis and interact with family and friends, but they are less likely to read the news or read books compared with the general population. Additionally, 28% say they have physical or health conditions that make reading difficult, much higher than the national benchmark of 16% (and the highest proportion of any group).
Technology use
Overall, Rooted and Roadblocked respondent are less technologically engaged, which might be related to their age and higher rate of physical limitations. This is not to say they’re offline—most (74%) use the internet, for instance, and 63% of those internet users use social networking sites—but the frequency and depth of their use is lower than that of the general population.
As will be discussed in the next section, they are also less likely to use library websites, and just 12% say it would be very easy to use the website of a local public library (many weren’t sure).

Defining information traits
Rooted and Roadblocked respondents are not terribly different from the general population in their media habits, though they are less likely to listen to music or the radio, or read the news or books, on a daily basis.

Looking closer at their reading and information habits, particularly their relationship to books and reading:
- As noted above, 58% say they read the news daily or almost every day, a slightly lower rate than the general population.
- 36% read books daily, and two-thirds (68%) read a book in the past year—fewer than many other groups (especially higher engagement groups).
- Overall, Rooted and Roadblocked respondents read an average of 11 books in the past 12 months, and a median of 3.
- 21% visit bookstores regularly, compared with 32% of the general population. They are also slightly more likely than other groups to say they usually buy their books (53%), rather than borrow them (32%).
Looking at their general information habits, a striking pattern emerged when we asked about the relative ease of completing various tasks. Less than half of the Rooted and Roadblocked group say they would be comfortable completing the various tasks on their own, and were particularly less likely to feel comfortable with the technology-related tasks (such as using social media or learning how to use new devices); almost a quarter (23%) say they would need help with all of them.

Relationship to public libraries
Public library use and experiences
Similar to other low engagement groups, 36% of the Rooted and Roadblocked have library cards, and they tend to have lower levels of personal use:
- Only a third (33%) visited a public library in the last 12 months, and those that do visit the library do so infrequently—among these recent visitors, a majority (64%) do so less than once a month.
- Just 6% of Rooted and Roadblocked respondents used a library website in the past year. Few feel comfortable interacting with libraries digitally: Though 49% say it would be “very easy” to visit a public library in person, just 12% say it would be very easy to use the website of a local public library (many also weren’t sure).
- Only 9% say their library use has increased in the past five years, while 60% say it has stayed about the same and 24% say it has decreased in that time.
They also don’t know very much about their local libraries. Just 5% know all or most of the services their library offers (compared with 23% of general population), and only 16% of those who have ever visited a library say it is usually very easy to find what they are looking for when they visit. However, the vast majority (92%) do know where the closest library is, with over three-quarters (76%) saying it is five miles away or closer.
Public library attitudes
Despite their low rates of general library use, Rooted and Roadblocked have generally positive feelings about public libraries, and are more likely to say that having a public library improves the quality of life in a community. However, many also do not have the familiarity with libraries to give an opinion one way or another, particularly regarding more recent changes—for instance, 46% did not know whether or not libraries do a good job keeping up with new technologies.
They also have positive views about their libraries’ physical presences, with 83% of those who have ever visited a library describing libraries are welcoming places, and 50% saying their library is a nice, pleasant place to be (though 25% say that they had never been inside).

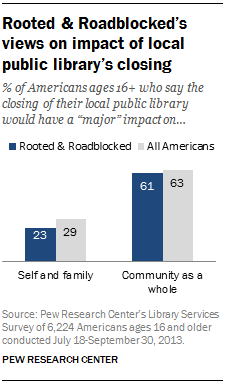
As noted earlier, members of the Rooted and Roadblocked group stand out from the other two low engagement groups by the level of importance they ascribe to their local public library. Specifically, they are significantly more likely than other low engagement groups to say library’s closing would impact them and their families, and their communities as a whole—at rates similar to the national benchmark.
Likewise, Rooted and Roadblocked members are only somewhat less likely than the general population to rank various individual services as “very important” to them and their families, though almost a third (32%) say that none of these services are very important.


