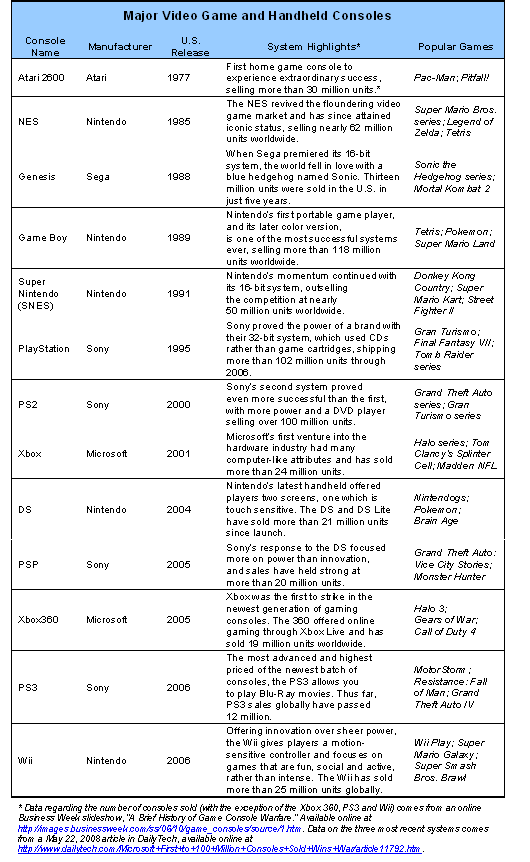
Appendix 1: Video Game and Console History Chart
Appendix 2: Regression Analysis
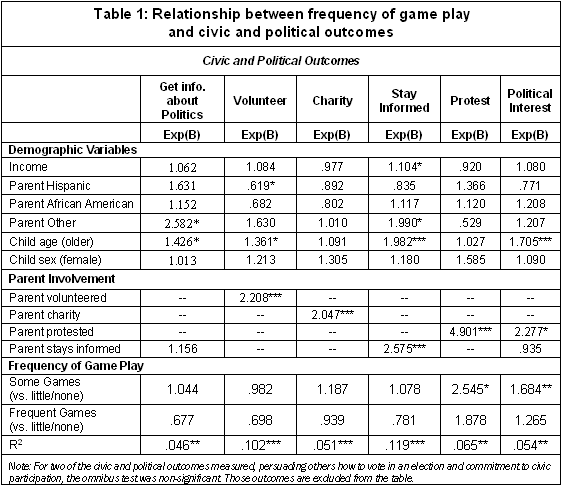
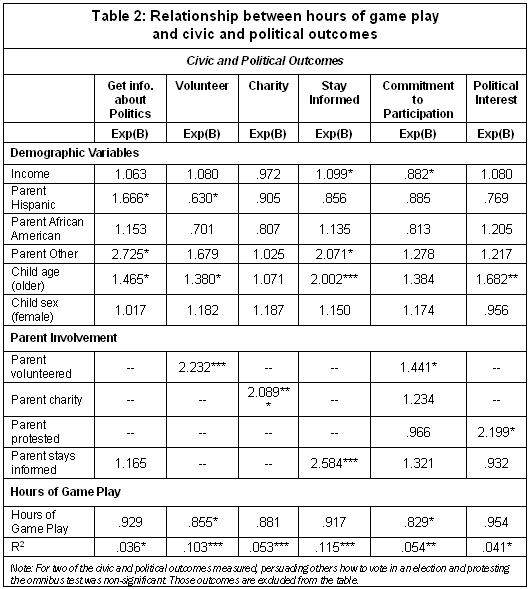
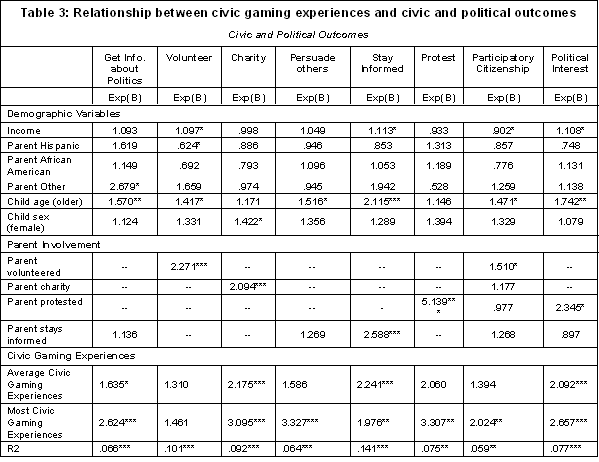
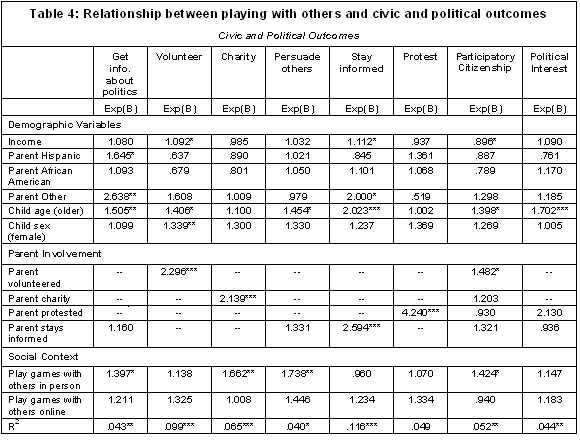
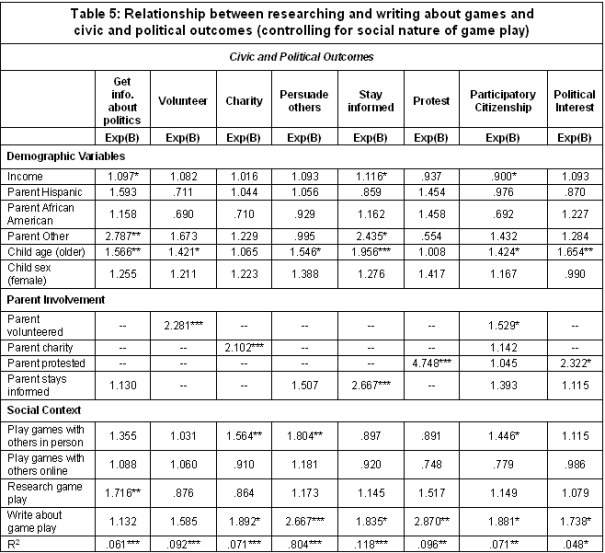
The findings regarding the relationship between frequency, social context and civic qualities of gaming experiences and life civic outcomes were derived using regression analysis. This statistical technique allows us to pinpoint whether a relationship between different gaming experiences and civic and political outcomes exists after controlling for factors such as income, race, gender and parent involvement—all individual characteristics that have been previously found to be important predictors of civic and political engagement.
Logistic regression was used in conducting the analyses, with the dependent variables being:
- Go online to get information about politics. (Yes/No)
- Volunteered in the last 12 months. (Yes/No)
- Raised money for charity in the last 12 months. (Yes/No)
- Persuaded others how to vote in an election in the last 12 months. (Yes/No)
- Stayed informed about politics or current events during the last 12 months. (Yes/No)
- Protested in the last 12 months. (Yes/No)
- Commitment to civic participation. (Agree/Disagree)
- Interest in politics. (Agree/Disagree)
To determine the relationship between frequency of gaming experiences and civic and political outcomes, each of the outcomes was modeled as a function of the following variables:
- Demographic: Parent income58 (a scale that runs from 1 to 8), race (white, African American, Hispanic, or other), gender, and age (binary variable with two categories: 12-14, 15-17).
- Parent Involvement: Included parent reports of whether, in the past 12 months, they volunteered, raised money for charity, protested, or stayed informed about politics or current events. For each outcome, the parental involvement item that most closely matched the outcome was included in the analysis.
- Frequency of game play: Frequency of game play was measured on an ordinal scale from 1-6 ranging from less than once a week to several times a day. For this analysis, frequency of game play was transformed into 3 categories—1) every few weeks or less, 2) 1-5 days a week, 3) daily or more. In all regression models, frequency of game play was entered as a dummy variable with the lowest frequency serving as the reference group.
To determine the relationship between the social context of game play and civic and political outcomes, each outcome was modeled as a function of the demographic and parent involvement variables described above and:
- Playing games with others in person: For the game they play most often, teen played games with other people who were in the same room as them. (Yes/No)
- Playing games with others online: For the game they play most often, teen played the game with people who were connected to them through the Internet. (Yes/No)
- Researching the game: Teen read or visit websites, reviews or discussion boards related to the games they play. (Yes/No)
- Contributing to online writing or discussion about the game: Teen writes or contributes to websites, reviews or discussion boards related to the games they play. (Yes/No)
To determine the relationship between civic gaming experiences and civic and political outcomes, each outcome was modeled as a function of the demographic and parent involvement variables described above and:
- Civic gaming experiences: The civic gaming experiences variable was created by averaging six items measured on a three-point scale (never, sometimes, and often). This continuous variable was then broken into three categorical variables—least civic gaming experiences, average civic gaming experiences, and most civic gaming experiences. Most civic gaming experiences included teens in the top 25% of frequency, average civic gaming experiences included teens in the middle 50%, and least gaming experiences included teens who fell into the bottom 25%. In all regressions, the variable was entered as a dummy variable with infrequent civic gaming experiences serving as the reference group.
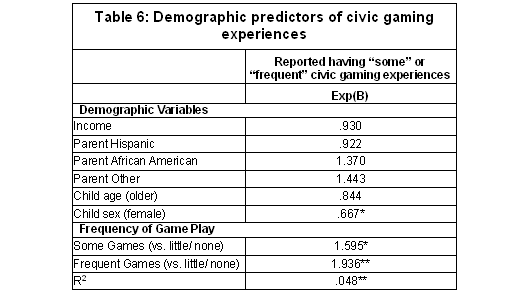
Finally, distribution of civic gaming experiences was analyzed using binary logistic regression with civic gaming experiences as the outcome (Infrequent vs. Average or Frequent) modeled as a function of demographic variables (parent income, race, gender, age) and frequency of game play which are described above.
Regression Results
