This report is based on the findings of a daily tracking survey on Americans’ use of the Internet. The results in this report are based on data from telephone interviews conducted by Princeton Survey Research Associates International between November 8 to December 4, 2006, among a sample of 2,562 adults, 18 and older. For results based on the total sample, one can say with 95% confidence that the error attributable to sampling is plus or minus 2.1 percentage points. For results based Internet users (n=1,727), the margin of sampling error is plus or minus 2.6 percentage points. In addition to sampling error, question wording and practical difficulties in conducting telephone surveys may introduce some error or bias into the findings of opinion polls.
This survey also reflects sa new reality for doing national phone sampling in 2006. A notable number of Americans now do not have landline telephones and can only be contacted for surveys through their cell phones. National household surveys taken in 2005 and 2006 found that 7%-9% of Americans were reachable only by cell phone, a number that was perhaps twice as high for younger people. The Pew Research Center now estimates that 10% of Americans are reachable only by cell phone. To try to account for this phenomenon, we conducted 200 interviews by phone with cell-only users. This addition makes our sample more representative of the national population.
The survey given to the cell-only users was about half the length of the survey given to landline users, so some of the analysis in this report includes material from the cell-only population and some of the analysis only involves those contacted through landlines.
There were two different samples for this survey. One was a random digit dial landline sample of telephone numbers selected from telephone exchanges in the continental United States. The random digit aspect of the sample is used to avoid “listing” bias and provides representation of both listed and unlisted numbers (including not-yet-listed numbers). The design of the sample achieves this representation by random generation of the last two digits of telephone numbers selected on the basis of their area code, telephone exchange, and bank number. A total of 2,362 interviews were obtained from the landline sample.
An additional 200 interviews were conducted with cell phone users who do not have access to a landline at their residence. The cell phone sample was drawn from 1000-blocks that have been allocated to one or more wireless service providers according to the most recent Telcordia TMP data file. The file is stratified by FIPS code, carrier name and 1000-block in an attempt to get a sample that is representative both geographically and by carrier. From a random start within the first sampling interval, systematic selections of 1000-blocks are performed and 3-digit random numbers are appended to each 1000-block stem to complete phone numbers. Survey Sampling Inc., the firm that developed this sample, did not screen the sample for disconnects or business numbers since that would violate TCPA rules prohibiting the automated dialing of wireless numbers. Only people contacted from the cell phone sample who did not use a landline were included in the survey. Those with access to a landline were screened out.
New sample was released daily and was kept in the field for at least five days for the RDD sample. The sample was released in replicates, which are representative subsamples of the larger population. This ensures that complete call procedures were followed for the entire sample. At least 10 attempts were made to complete an interview at sampled phone numbers. The calls were staggered over times of day and days of the week to maximize the chances of making contact with a potential respondent. Each household received at least one daytime call in an attempt to find someone at home. In each landline contacted household, interviewers asked to speak with the youngest male currently at home. If no male was available, interviewers asked to speak with the youngest female at home. This systematic respondent selection technique has been shown to produce samples that closely mirror the population in terms of age and gender. All interviews completed on any given day were considered to be the final sample for that day.
For the cell phone sample, interviewers attempted to conduct an interview with the person who answered the phone once they confirmed that the respondent was not driving or doing anything else that might be dangerous. Interviewers also confirmed that the person was at least 18 years old. Only respondents who identified their cell phone as their only phone continued with the main interview. Those who also had access to a landline at their residence were screened out of the survey as ineligible. To encourage participation, an incentive of $10 was offered to each eligible respondent who completed the interview. The CPO questionnaire contained a subset of questions from the original landline Post-Election November Tracking Survey.
Non-response in telephone interviews produces some known biases in survey-derived estimates because participation tends to vary for different subgroups of the population, and these subgroups are likely to vary also on questions of substantive interest. In order to compensate for these known biases, the sample data are weighted in analysis. The demographic weighting parameters are derived from a special analysis of the most recently available Census Bureau’s March 2005 Annual Social and Economic Supplement. This analysis produces population parameters for the demographic characteristics of adults age 18 or older, living in households that contain a telephone.9 These parameters are then compared with the sample characteristics to construct sample weights. The weights are derived using an iterative technique that simultaneously balances the distribution of all weighting parameters.
Following is the full disposition of all sampled telephone numbers:
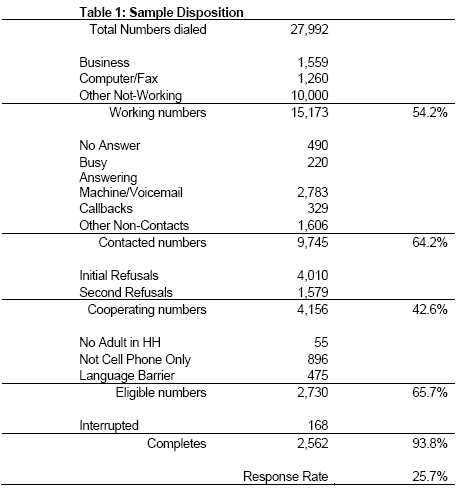
PSRAI calculates a response rate as the product of three individual rates: the contact rate, the cooperation rate, and the completion rate. Of the phone numbers in the sample, 64 percent were contacted by an interviewer and 43 percent agreed to participate in the survey. Sixty-six percent were found eligible for the interview. Furthermore, 94 percent of eligible respondents completed the interview. Therefore, the final response rate is 26 percent.
Another change we have made in this analysis is that we often report our findings by citing the percentage of the overall American adult population (those age 18 and older) who have done something online or believe something. In the past we have sometimes cited the millions of Americans who have done political activities online. We feel that while it is possible to estimate the actual number of Americans who are doing certain things online, it is a bit more useful and practical to cite the percentage.

