
The American Trends Panel survey methodology
The American Trends Panel (ATP), created by Pew Research Center, is a nationally representative panel of randomly selected U.S. adults. Panelists participate via self-administered web surveys. Panelists who do not have internet access at home are provided with a tablet and wireless internet connection. The panel is being managed by Ipsos.
Data in this report are drawn from the panel wave conducted December 3 to December 23, 2019. A total of 3,030 panelists responded out of 5,395 who were sampled, for a response rate of 56%. This includes 2,094 from the ATP and an oversample of 936 respondents sampled from Ipsos’ KnowledgePanel. The cumulative response rate accounting for nonresponse to the recruitment surveys and attrition is 2.4%. The break-off rate among panelists who logged onto the survey and completed at least one item is 0.4%. The margin of sampling error for the full sample of 3,030 respondents is plus or minus 2.9 percentage points.
The ATP sample consisted of all current panel members who previously identified as being Hispanic. For the KnowledgePanel sample, Hispanics who were either born in Mexico or had no more than a high school education were oversampled relative to those who had more than a high school education and were born outside of Mexico.
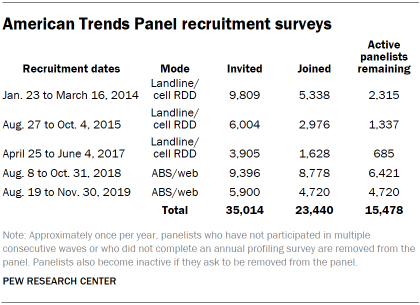
The ATP was created in 2014, with the first cohort of panelists invited to join the panel at the end of a large, national, landline and cellphone random-digit-dial survey that was conducted in both English and Spanish. Two additional recruitments were conducted using the same method in 2015 and 2017, respectively. Across these three surveys, a total of 19,718 adults were invited to join the ATP, of which 9,942 agreed to participate.
In August 2018, the ATP switched from telephone to address-based recruitment. Invitations were sent to a random, address-based sample (ABS) of households selected from the U.S. Postal Service’s Delivery Sequence File. In each household, the adult with the next birthday was asked to go online to complete a survey, at the end of which they were invited to join the panel. For a random half-sample of invitations, households without internet access were instructed to return a postcard. These households were contacted by telephone and sent a tablet if they agreed to participate. A total of 9,396 were invited to join the panel, and 8,778 agreed to join the panel and completed an initial profile survey. The same recruitment procedure was carried out on August 19, 2019, from which a total of 5,900 were invited to join the panel and 4,720 agreed to join the panel and completed an initial profile survey. Of the 23,440 individuals who have ever joined the ATP, 15,478 remained active panelists and continued to receive survey invitations at the time this survey was conducted.
The USPS Delivery Sequence File has been estimated to cover as much as 98% of the population, although some studies suggest that the coverage could be in the low 90% range.7
Weighting
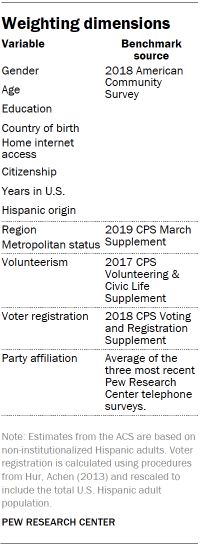
The ATP data was weighted in a multistep process that begins by calibrating the entire panel so that it aligns with the population benchmarks identified in the accompanying table to create a full-panel weight. For ATP waves in which only a subsample of panelists are invited to participate, a wave-specific base weight is created by adjusting the full-panel weights for subsampled panelists to account for any differential probabilities of selection for the particular panel wave. The next step in the weighting uses an iterative technique that aligns the sample to population benchmarks on the dimensions listed in the accompanying table. For this wave, additional weighting parameters were added to adjust for citizenship, years in the U.S., country of birth and Hispanic origin.
Sampling errors and test of statistical significance take into account the effect of weighting. Interviews are conducted in both English and Spanish.
In addition to sampling error, one should bear in mind that question wording and practical difficulties in conducting surveys can introduce error or bias into the findings of opinion polls.
The following table shows the unweighted sample sizes and the error attributable to sampling that would be expected at the 95% level of confidence for different groups in the survey:
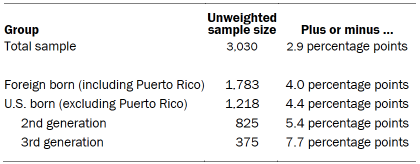
For the purposes of this report, references to foreign-born Hispanics include those born in Puerto Rico. Individuals born in Puerto Rico are U.S. citizens by birth. Sample sizes and sampling errors for other subgroups are available upon request.
Online search data
Trends in online search data volume used in this report are based on data from Google Trends, a publicly available web-based tool that measures search volume of a specific search term across time, in specific languages and in specific countries. In this report, search term data are for the terms for “Latinx,” “Latina,” “Latino” and “Hispanic” among searches conducted in the U.S. Monthly data were downloaded for the period of Jan. 1, 2004, through June 30, 2020.8
Google standardizes online searches on a 0 to 100 scale for the time period selected by the user, with 100 representing the peak level of searches given a region and time period. Internet search data analysis like that available from Google Trends has limitations. Internet search data is an indicator of interest in a topic, not attitudes toward it. Actual motivation for searches or behavior related to searches cannot be authenticated using Google Trends alone.
CORRECTION. (September 2020): A previous version of this methodology statement contained an incorrect description of the base weighting for this survey. None of the study findings or conclusions are affected.


