From 2005 to 2011, an average of about 48,000 Puerto Ricans a year moved from the island of Puerto Rico to the U.S. mainland, according to a Pew Research Center analysis of data from the American Community Survey. The annual totals ranged from 44,000 to 52,000.
Looking only at island-born migrants of Puerto Rican origin, 40,000 people on average left the island for the mainland each year. The annual totals ranged from 37,000 to 44,000 people.
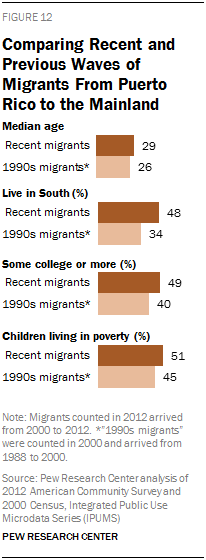
A Pew Research comparison of recent island-born migrants who left Puerto Rico for the mainland with those who relocated in the late 1980s and throughout the 1990s finds the newer migrants have lower household incomes and homeownership levels, and higher poverty rates. There also are other marked differences in where the two groups live and in their education levels.
Although more recent Puerto Rican migrants to the mainland are better educated than earlier waves, more recent migrants in the prime working ages (30-64 in 2011) are less educated than people who remain on the island, according to other research (Mora, Davila and Rodriguez, 2014). A Pew Research analysis of census data indicates that Puerto Ricans on the island are more likely than island-born Puerto Ricans living stateside to have at least a bachelor’s degree (24% versus 15% in 2012). A lower share did not finish high school (27% to 32%).
Recent migrants, especially men, compared with earlier migrants, also are more likely to hold blue-collar jobs in low-skilled industries such as construction, maintenance and agriculture, and less likely to hold professional jobs (Birson, 2014). On the island, the earnings payoff for those holding college degrees rose more from 2006 to 2011 than for those on the mainland, which means that less-skilled workers had more incentive than high-skilled ones to migrate (Mora, Davila and Rodriguez, 2014).
This new migration pattern differs from the “brain drain” pattern that some research points to in earlier generations of migrants and could indicate that migration now is part of a cycle that further weakens the Puerto Rican economy, rather than being an outlet for people seeking refuge from unemployment (Birson, 2014).
This section uses U.S. Census Bureau data to compare characteristics of Puerto Rican island-born migrants in 2012 who arrived in the years from 2000 to 2012 with comparable migrants in 2000 who arrived in the years from 1988 to 2000.14
Characteristics and Geographic Distribution
More recent migrants are somewhat older, with a higher median age. As table 2 in Appendix A shows, they are less likely to be ages 18-29 (23% vs. 28%) and more likely to be 40 or older (27% vs. 22%).
In a reflection of the greater dispersion of the Puerto Rican population on the mainland outside the Northeast, a higher share of more recent island-born migrants (48%) than earlier ones (34%) settle in the South, according to data within 12 years of their arrival. The newer island-born migrants also are somewhat more likely to settle in Florida (31% vs. 25%).
Meanwhile, the Northeast, the traditional destination of past waves of Puerto Rican migrants, has been less of a magnet for newer island-born migrants: 41% of recent migrants live there now, compared with 54% of those who arrived in the late 1980s and 1990s and were counted in 2000. A smaller share of recent migrants, compared with earlier ones, settled in New York (9% vs. 17%).
Both waves of island-born migrants have similar earnings within 12 years of arrival, but household incomes are higher for the earlier migrants ($32,740 in 2012 dollars, compared with $25,000 for more recent migrants). The homeownership rate also is lower for more recent migrants (22% to 26%), perhaps reflecting a decline in the overall U.S. homeownership rate compared with the late 1990s.
However, a higher share in each age group is in poverty among recent arrivals compared with earlier ones. Among children, 51% of recent migrants and 45% of 1990s migrants lived in poverty.