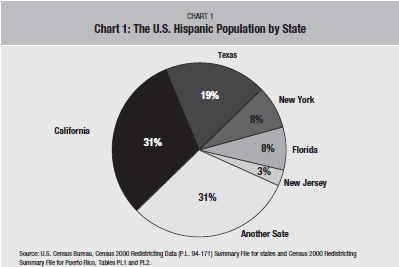
Data from the 2002 National Survey of Latinos allows comparisons of the views and experiences of Latinos living in five states with large Latino populations: California, Texas, New York, New Jersey, and Florida. Nearly seven in ten Latinos in the United States live in these five states, with the largest populations residing in California (31% of Latinos in the United States) and Texas (19%), followed by New York (8%), Florida (8%), and New Jersey (3%) (Chart 1).
The significance of country of origin
Country of origin, or the birthplace of Latinos and their ancestors, is one of the biggest differentiators between the Latino populations in California, Texas, New York, New Jersey, and Florida. As was noted in the report on the major findings of the 2002 National Survey of Latinos, attitudes and experiences diff er among country of origin groups. Because they can diff er so dramatically, it is important to keep in mind the background of the populations we examine in this survey brief, and note that some of the differences could be at least partially attributed to variation in ancestral background.
Notable differences between states with regards to country of origin include (see Table 1):
- The Latino population in California (84%) and Texas (83%) is overwhelmingly Mexican. There is also a Central American presence in these two states (9% and 5%, respectively), however it is much smaller.
- The plurality (41%) of Latinos in Florida is Cuban, however there are sizeable proportions of Puerto Ricans (18%), Mexicans (17%), and South Americans (13%) in the state as well.
- Latinos in New York and New Jersey are divided among Puerto Ricans (33% and 30%, respectively), Dominicans (31% and 21%, respectively), and South Americans (13% and 21%, respectively).

Nearly two thirds (63%) of Latinos in the United States are foreign-born. These are Latinos who were born outside of the fifty states, as well as those who were born in Puerto Rico, a commonwealth associated with the United States. New York (77%), New Jersey (77%), and Florida (76%) have a higher proportion of foreign-born Latinos than California (64%) and Texas (54%). It is also important to note that these states have the largest proportions of Puerto Ricans as well. About three in ten Latinos from New York (33%) and New Jersey (30%) are Puerto Rican, and nearly two in ten (18%) Latinos from Florida are Puerto Rican.
Foreign-born Latinos from New York appear to have the closest ties to their country of origin. When asked if they consider the country where they were born or the United States their true homeland, over seven in ten (71%) foreign-born Latinos from New York say they consider their real homeland the country where they were born, compared to 64% of foreign-born Latinos from Texas, 57% from California, 56% from New Jersey, and 54% from Florida.
Furthermore, nearly half (47%) of foreign-born Latinos in New York plan to someday move back to the country where they were born, compared to 39% of foreign-born Latinos from New Jersey, 34% from California, 31% from Texas, and 30% from Florida. Foreign-born Latinos from New York are also the most likely to send money back to their country of origin on a regular basis. Over six in ten (61%) foreign-born Latinos from New York report sending money back to their country of origin on a regular basis, compared to less than half of foreign-born Latinos from California (48%), Florida (46%), New Jersey (46%), and Texas (30%).


The majority of the foreign-born population in each of these states has returned to their country of origin for a visit, however foreign-born Latinos in Florida are the least likely group to have done so. Forty-four percent of foreign-born Latinos in Florida report they have never been back to their country of origin for a visit, compared to less than three in ten foreign-born Latinos from California (28%), New Jersey (28%), New York (24%), and Texas (21%). This difference is likely due to the high proportion of Cubans in Florida, and the political barriers of visiting Cuba.
Identity
In general, the way Latino populations primarily identify themselves in New York, Florida, New Jersey, and to some extent, California, is very similar (see Table 2). Most Latinos refer to themselves first or only by their country of origin (for example, “Mexican”), while smaller groups primarily call themselves Latinos/Hispanics or Americans.
The Latino population in Texas is different. Although many Latinos in Texas (43%) refer to themselves primarily by their country of origin, they are more likely than Latinos in other states to refer to themselves as Latinos or Hispanics (33%). Furthermore, Latinos in Texas (45%) are more likely to prefer the term “Hispanic” than Latinos in other states. However, it is important to note that about half of Latinos in all of the states have no preference between the two terms (see Table 3).
Discrimination Against Latinos
Latinos across the five states report having had similar experiences with discrimination. Around three in ten Latinos from California (30%), Texas (34%), Florida (27%), New York (28%), and New Jersey (34%) report they, a family member, or a close friend have experienced discrimination during the last five years because of their racial or ethnic background. Similar percentages also report receiving poorer service than other people at restaurants or stores (41% of all Latinos), being called names or insulted (30%), or not being hired or promoted for a job (14%) because of their race or ethnic background.
Although their experiences with discrimination have been similar, Latinos’ attitudes about discrimination diff er among states (see Table 4). The vast majority of Latinos feels that discrimination against Latinos is a problem in schools (75%) and the workplace (78%), and in preventing Latinos in general from succeeding in America (82%). However, Latinos in New York and New Jersey are more likely than Latinos from Florida, Texas, and in some cases California, to feel that discrimination in these areas is a major problem.
Latinos who have been discriminated against in New York and New Jersey also diff er slightly in their opinions as to why they were discriminated against. The majority of Latinos who have been discriminated against in New York (53%) and New Jersey (62%) believe the primary reason they were discriminated against was because of the language that they speak. Many Latinos in California (42%), Texas (43%), and Florida (47%) agree, but they are more likely than those in New Jersey, and in some cases New York, to say that the main reason they are discriminated against is because of their physical appearance. Nearly four in ten (39%) Latinos from California, 35% of Latinos from Texas, and 30% of Latinos from Florida say the primary reason they were discriminated against was their physical appearance, compared to 27% of Latinos from New York, and 17% of Latinos from New Jersey.

Latinos Discriminating Against Other Latinos
Not only do Latinos feel that discrimination against Latinos is a problem in the United States, the vast majority also feels that Latinos discriminating against other Latinos is a problem as well. The majority of Latinos in New York (54%) and New Jersey (55%) reports that Latinos discriminating against other Latinos is a major problem, which is similar to what is reported by Latinos in California (50%) and Texas (47%), and only slightly higher than what is reported by Latinos in Florida (42%).
Latinos in these states, however, disagree on the main reason this discrimination takes place. Among Latinos who feel Latinos discriminating against other Latinos is a problem, Latinos in Florida (47%), New York (43%), and New Jersey (43%) are more likely than Latinos from California (30%) and Texas (27%) to say the main reason for this discrimination is that Latinos come from different countries. Latinos from California (43%) and Texas (47%) are more likely than Latinos from Florida (36%) and New York (28%) to say the primary reason Latinos discriminate against other Latinos is because of the differences in levels of income and education.
Perhaps the fact that Latinos from these different states disagree on the main reason discrimination takes place reflects the differing demographic makeup of these states. California and Texas are much more homogeneous with respect to country of origin. The vast majority of Latinos in California and Texas is Mexican, compared to the Latino populations in New York, New Jersey, and Florida, where there is much more diversity. Therefore, it is possible that Latinos in California and Texas may interact with Latinos of different backgrounds less often and have less interaction with Latinos from other countries of origin.
Citizenship and Politics
Most Latinos in the United States are citizens. However, Latinos in California (54%) are slightly less likely to report being citizens than Latinos in Texas (62%), New York (63%), New Jersey (65%), or Florida (65%). Of those who are citizens, the percent reporting they are registered to vote in the United States is similar—81% of Latino citizens in New York, 77% in New Jersey, 76% in California, 75% in Texas, and 73% in Florida say they are registered to vote in the United States.
Among those who are registered to vote, party affiliation differs by state (see Table 5). Latinos who reside in Florida (42%) are more likely to say they are Republican than Latinos who live in Texas (22%), California (19%), or New York (13%). Registered Latinos in these states, especially those in California (58%) and New York (60%), are more likely to consider themselves Democrats.
Most Latinos in these states agree that they would rather pay higher taxes to support a larger government (60%) than pay lower taxes and have a smaller government (34%). A majority also agrees that the government (52%) can do the best job of providing services to people in need, instead of religious, charitable, or community organizations (40%). Where Latinos in these states diff er, however, is on their trust in the federal government (see Table 6). Latinos in Florida are the most trusting in government, with nearly six in ten (59%) trusting the government to do what is right just about always or most of the time. Half of Latinos from Texas agree, followed by 45% of Latinos from New Jersey, 40% from California, and 37% from New York.
Conclusion
As we have seen, Latino populations in California, Texas, New York, New Jersey, and Florida diff er tremendously by country of origin and, to a lesser extent, by the proportion that were born in the United States. It is not surprising given historical events and a common border that most Latino residents in California and Texas are Mexican, while the Latinos in Florida, New York and New Jersey have a much more varied background. Also Latinos in California and Texas are more likely to have been born in the United States than those in Florida, New York and New Jersey.
These differences in provenance and nativity appear to underlie many of the differences in opinion and experience seen between the populations of these five states, including how Latinos chose to identify themselves, foreign-born Latinos connection with their country of birth, and the perceived reasons behind discrimination. However, as pointed out earlier, most Latinos are U.S. citizens and thus, eligible to vote. Therefore, especially as the Latino population continues to grow, it is important to explore these regional differences in the Latino population because they may increasingly affect the outcomes of local and state elections.

Methodology
The Pew Hispanic Center/Kaiser Family Foundation 2002 National Survey of Latinos was conducted by telephone between April 4 and June 11, 2002 among a nationally representative sample of 4,213 adults, 18 years and older, who were selected at random. Representatives of the Pew Hispanic Center and the Kaiser Family Foundation worked together to develop the survey questionnaire and analyze the results. International Communications Research of Media, PA conducted the fieldwork in either English or Spanish, based on the respondent’s preference.
The sample design employed a highly stratified disproportionate RDD sample of the 48 contiguous states, including oversamples for Salvadorans, Dominicans, Colombians, and Cubans. The results are weighted to represent the actual distribution of adults throughout the United States. The Latino sample, in particular, was weighted to reflect the actual distribution among Latino adults of country of origin, age, sex, and region.
Of those who were interviewed, 2,929 identified themselves as being of Hispanic or Latin origin or descent (based on the question “Are you, yourself of Hispanic or Latin origin or descent, such as Mexican, Puerto Rican, Cuban, Dominican, Central or South American, Caribbean or some other Latin background?”). Throughout this report, they will be referred to interchangeably as either “Latinos” or “Hispanics.” In addition, interviews were conducted with 1,008 non- Hispanic whites and 171 non-Hispanic African Americans. The margin of sampling error is +/- 2.41 percentage points for Latinos overall. The sample sizes and margins of error for the different state groups are shown in the table below. The report also highlights results for other subgroups of Latinos. Please see the introduction of the report for definitions, sample sizes, and margins of sampling error for these key groups.

About the 2002 National Survey of Latinos
In the 2000 Census, some 35,306,000 people living in the United States identified themselves as Hispanic/Latino. That represented a 142% increase over the 1980 Census count, and means that Latinos now make up nearly 13% of the U.S. population overall. This rapid growth is among one of the most important demographic trends shaping the future of the United States. Recognizing this fact, the Kaiser Family Foundation and the Pew Hispanic Center joined forces to conduct a comprehensive national survey of the Hispanic population.
The Pew Hispanic Center/Kaiser Family Foundation 2002 National Survey of Latinos explored the attitudes and experiences of Latinos on a wide variety of topics. The survey sample was designed to include enough Hispanics from various backgrounds and national origin groups so that in addition to describing Latinos overall, comparisons also could be made among segments of the Hispanic population.