
This analysis in this report is based on telephone interviews conducted September 17-22, 2019 among a national sample of 1,004 adults, 18 years of age or older, living in the United States (302 respondents were interviewed on a landline telephone, and 702 were interviewed on a cell phone, including 492 who had no landline telephone). The survey was conducted under the direction of SSRS. A combination of landline and cell phone random digit dial samples were used. Interviews were conducted in English (969) and Spanish (35). Respondents in the landline sample were selected by randomly asking for the youngest adult male or female who is now at home. Interviews in the cell sample were conducted with the person who answered the phone, if that person was an adult 18 years of age or older. For detailed information about our survey methodology, see http://www.pewresearch.org/methodology/u-s-survey-research/
The combined landline and cellphone sample are weighted to provide nationally representative estimates of the adult population 18 years of age and older. The weighting process takes into account the disproportionate probabilities of household and respondent selection due to the number of separate telephone landlines and cellphones answered by respondents and their households, as well as the probability associated with the random selection of an individual household member. Following application of the above weights, the sample is post-stratified and balanced by key demographics such as age, race, sex, region, and education. The sample is also weighted to reflect the distribution of phone usage in the general population, meaning the proportion of those who are cellphone only, landline only, and mixed users.
The following table shows the unweighted sample size and the error attributable to sampling that would be expected at the 95% level of confidence for different groups in the U.S. in the survey:
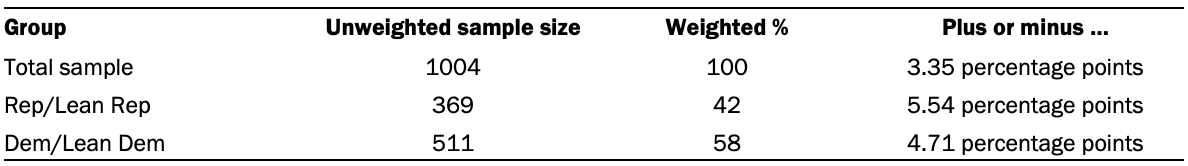
Sample sizes and sampling errors for subgroups are available upon request.
In addition to sampling error, one should bear in mind that question wording and practical difficulties in conducting surveys can introduce error or bias into the findings of opinion polls.


