
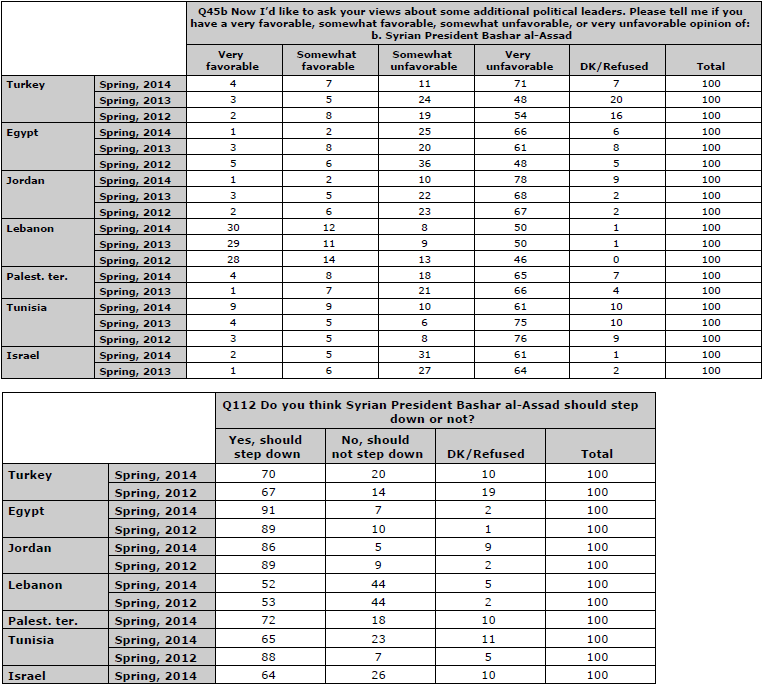
Survey Topline
Survey Methods
About the 2014 Spring Pew Global Attitudes Survey
Results for the survey are based on face-to-face interviews conducted under the direction of Princeton Survey Research Associates International. Survey results are based on national samples. For further details on sample designs, see below.
The descriptions below show the margin of sampling error based on all interviews conducted in that country. For results based on the full sample in a given country, one can say with 95% confidence that the error attributable to sampling and other random effects is plus or minus the margin of error. In addition to sampling error, one should bear in mind that question wording and practical difficulties in conducting surveys can introduce error or bias into the findings of opinion polls.
| Country: | Egypt |
| Sample design: | Multi-stage cluster sample stratified by governorates and urbanity |
| Mode: | Face-to-face adults 18 plus |
| Languages: | Arabic |
| Fieldwork dates: | April 10 – April 29, 2014 |
| Sample size: | 1,000 |
| Margin of error: | +/-4.3 percentage points |
| Representative: | Adult population (excluding frontier governorates, or about 2% of the population) |
| Country: | Israel |
| Sample design: | Multi-stage cluster sample stratified by district, urbanity, and socioeconomic status, with an oversample of Arabs |
| Mode: | Face-to-face adults 18 plus |
| Languages: | Hebrew, Arabic |
| Fieldwork dates: | April 24 – May 11, 2014 |
| Sample size: | 1,000 (597 Jews, 388 Arabs, 15 others) |
| Margin of Error: | +/-4.3 percentage points |
| Representative: | Adult population (The data were weighted to reflect the actual distribution of Jews, Arabs and others in Israel.) |
| Country: | Jordan |
| Sample design: | Multi-stage cluster sample stratified by governorate and urbanity |
| Mode: | Face-to-face adults 18 plus |
| Languages: | Arabic |
| Fieldwork dates: | April 11 – April 29, 2014 |
| Sample size: | 1,000 |
| Margin of Error: | +/-4.5 percentage points |
| Representative: | Adult population |
| Country: | Lebanon |
| Sample design: | Multi-stage cluster sample stratified by region and urbanity |
| Mode: | Face-to-face adults 18 plus |
| Languages: | Arabic |
| Fieldwork dates: | April 11 – May 2, 2014 |
| Sample size: | 1,000 |
| Margin of Error: | +/-4.1 percentage points |
| Representative: | Adult population (excluding a small area in Beirut controlled by a militia group and a few villages in the south of Lebanon, which border Israel and are inaccessible to outsiders, or about 2% of the population) |
| Country: | Palestinian territories |
| Sample design: | Multi-stage cluster sample stratified by region and urban/rural/refugee camp population |
| Mode: | Face-to-face adults 18 plus |
| Languages: | Arabic |
| Fieldwork dates: | April 15 – April 22, 2014 |
| Sample size: | 1,000 |
| Margin of Error: | +/-4.4 percentage points |
| Representative: | Adult population (excluding Bedouins who regularly change residence and some communities near Israeli settlements where military restrictions make access difficult, or roughly 5% of the population) |
| Country: | Tunisia |
| Sample design: | Multi-stage cluster sample stratified by governorate and urbanity |
| Mode: | Face-to-face adults 18 plus |
| Languages: | Tunisian Arabic |
| Fieldwork dates: | April 19 – May 9, 2014 |
| Sample size: | 1,000 |
| Margin of Error: | +/-4.0 percentage points |
| Representative: | Adult population |
| Country: | Turkey |
| Sample design: | Multi-stage cluster sample stratified by region, urbanity and settlement size |
| Mode: | Face-to-face adults 18 plus |
| Languages: | Turkish |
| Fieldwork dates: | April 11 – May 16, 2014 |
| Sample size: | 1,001 |
| Margin of Error: | +/-4.5 percentage points |
| Representative: | Adult population |
