
Pew Research Center’s surveys have shed light on public opinion around some of the biggest news events of 2022 – from Russia’s military invasion of Ukraine to the overturning of Roe v. Wade to Americans’ experiences with extreme weather events. Here’s a look back at the past year through 15 of our most striking research findings, which cover these topics and more. These findings represent just a sample of the Center’s research publications this year.
Today, roughly four-in-ten Americans (41%) say none of their purchases in a typical week are paid for using cash, a July survey found. This is up from 29% in 2018 and 24% in 2015.
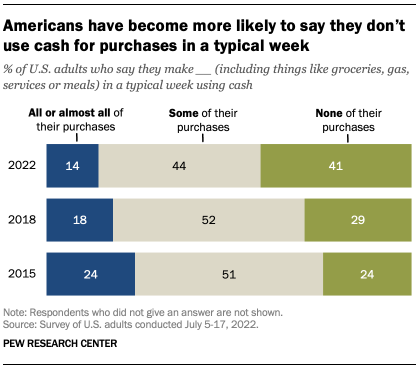
Meanwhile, the portion of Americans who say that all or almost all of their purchases are paid for with cash in a typical week has declined from 24% in 2015 to 18% in 2018 to 14% today.
While growing shares of Americans across income groups are relying less on cash than in the past, this is especially the case among the highest earners. Roughly six-in-ten adults whose annual household income is $100,000 or more (59%) say they make none of their typical weekly purchases using cash, up sharply from 43% in 2018 and 36% in 2015.
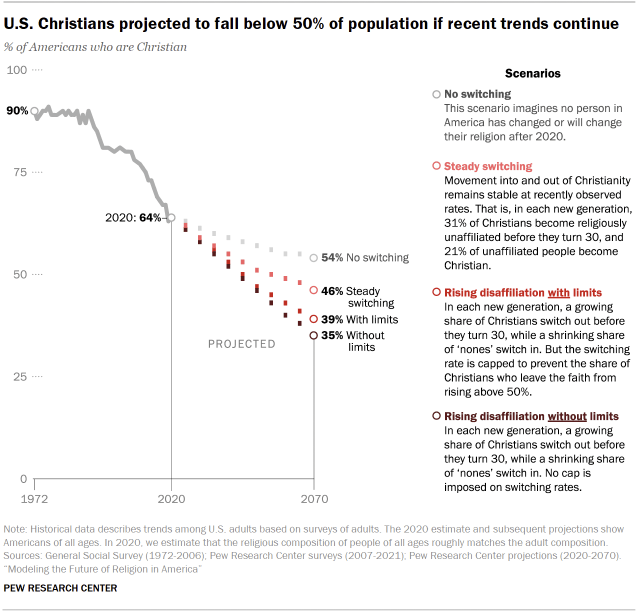
If recent trends continue, Christians could make up a minority of Americans by 2070. That’s according to a September report that models several hypothetical scenarios of how the U.S. religious landscape might change over the next 50 years, based on religious switching patterns.
Since the 1990s, large numbers of Americans have left Christianity to join the growing ranks of U.S. adults who describe their religious identity as atheist, agnostic or “nothing in particular.”
Depending on whether religious switching continues at recent rates, speeds up or stops entirely – the last of which is not plausible because it assumes all switching has already ended – the projections show Christians of all ages shrinking from 64% to somewhere between 54% and 35% of all Americans by 2070. Over that same period, “nones” would rise from their current 30% of the population to somewhere between 34% and 52%.
Views of reparations for slavery vary widely by race and ethnicity, especially between Black and White Americans, a November analysis found. Overall, 30% of U.S. adults say descendants of people enslaved in the United States should be repaid in some way, such as given land or money. About seven-in-ten (68%) say these descendants should not be repaid.
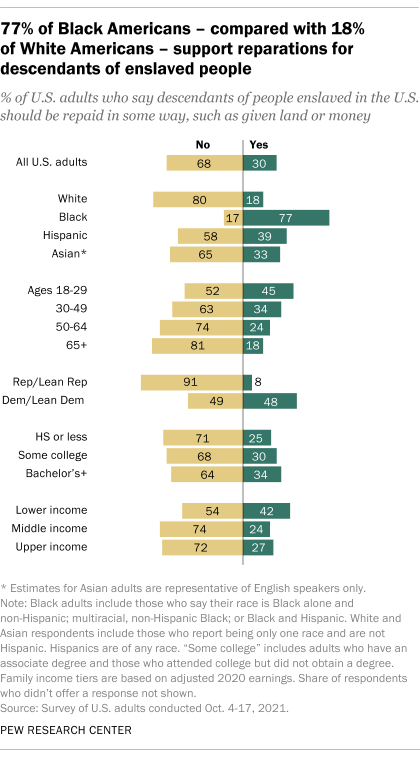
Around three-quarters of Black adults (77%) say the descendants of people enslaved in the U.S. should be repaid in some way. Just 18% of White adults hold this view.
There are also notable differences by party affiliation and age. Among Democrats and Democratic-leaning independents, views are split: 48% say descendants of enslaved people should be repaid in some way, while 49% say they should not. Only 8% of Republicans and GOP leaners say these descendants should be repaid in some way, and 91% say they should not.
And 45% of adults under 30 say these descendants should be repaid, compared with 18% of those 65 and older.
Notably, three-quarters of adults who say descendants of those enslaved in the U.S. should be repaid (including 82% of Black adults who say this) say it’s a little or not at all likely this will happen in their lifetime.
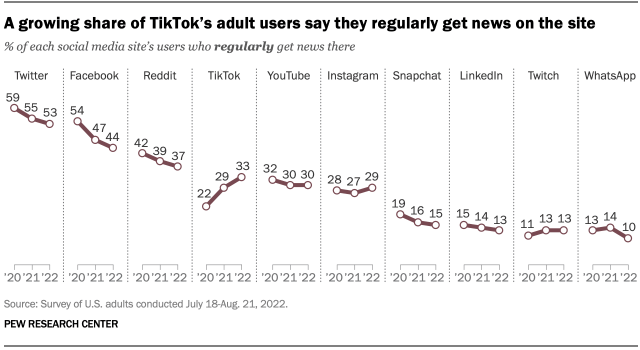
A growing share of adult TikTok users in the U.S. are getting news on the platform, bucking the trend on other social media sites, according to a survey fielded in July and August. A third of adults who use TikTok say they regularly get news there, up from 22% two years ago. The increase comes even as news consumption on many other social media sites has either decreased or stayed about the same in recent years. For example, the share of adult Facebook users who regularly get news there has declined from 54% in 2020 to 44% this year.
Most Americans who have experienced extreme weather in the past year – including majorities in both political parties – see climate change as a factor, according to a May survey.
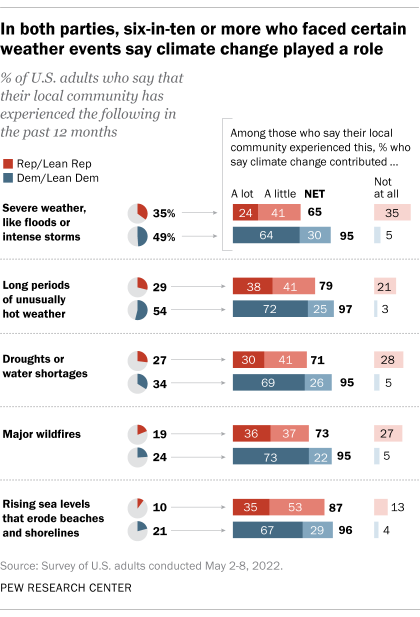
Overall, 71% of Americans said that, in the past 12 months, their community had experienced at least one of the five forms of extreme weather the Center’s survey asked about. Among those who had recently encountered extreme weather, more than eight-in-ten said climate change contributed at least a little to each type of event.
Among Democrats as well as Republicans, majorities of those who had experienced one of these forms of extreme weather said climate change contributed to the event. But Democrats were more likely than Republicans to say climate change contributed a lot.
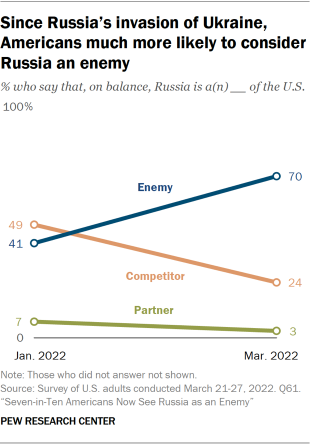
Following Russia’s military invasion of Ukraine, Americans became much more likely to see Russia as an enemy of the United States. In March, just after the invasion, 70% of Americans said that, on balance, Russia is an enemy of the U.S., up sharply from 41% who held this view in January. In the January survey, Americans were more likely to describe Russia as a competitor of the U.S. than as an enemy. In both surveys, very few Americans described Russia as a U.S. partner.
Democrats and Republicans largely agreed in the March survey that Russia is an enemy of the U.S., but partisan and ideological differences still existed. Liberal Democrats, for example, were the most likely to see Russia as an enemy (78%), while moderate and liberal Republicans were the least likely to do so (63%).
Relatively few Americans take an absolutist view on the legality of abortion – either supporting or opposing it at all times, according to a survey conducted in March, before the Supreme Court overturned Roe v. Wade. The vast majority of the public is somewhere in the middle when it comes to abortion: Most think it should be legal in at least some circumstances, but most are also open to limitations on its availability in others.
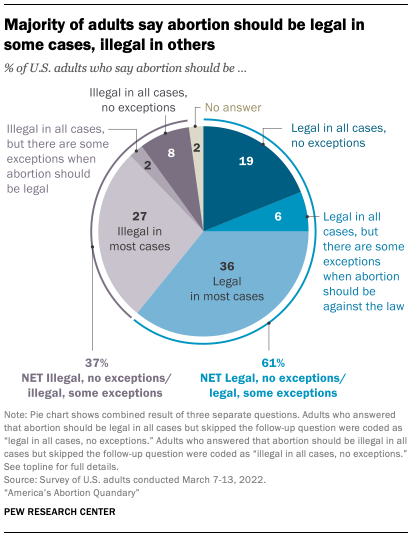
Overall, 19% of Americans say that abortion should be legal in all cases, with no exceptions. Fewer (8%) say abortion should be illegal in every case, without exception. But 71% either say it should be mostly legal or mostly illegal, or say there are exceptions to their blanket support for or opposition to legal abortion.
A separate survey conducted in June and July – after the Supreme Court struck down Roe – found that 57% of adults disapproved of the decision, including 43% who strongly disapproved. About four-in-ten (41%) approved, including 25% who strongly approved.
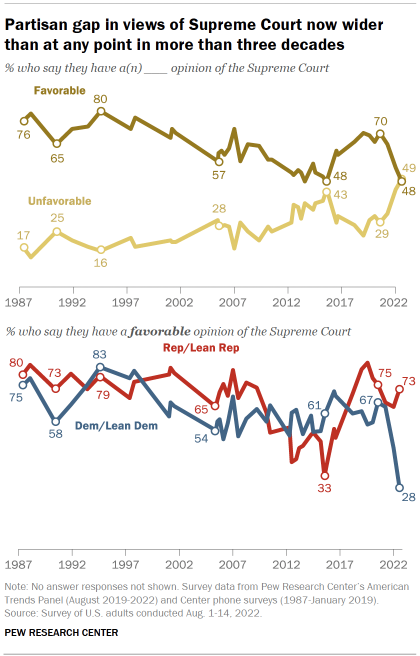
Following the Supreme Court’s decision to overturn Roe v. Wade, the partisan gap in views of the court grew wider than at any point in more than three decades. While 73% of Republicans expressed a favorable view of the court in an August survey, only 28% of Democrats shared that view. That 45-point gap was wider than at any point in 35 years of polling on the court.
The current polarization follows a term that included the ruling on abortion and several other high-profile cases that often split the justices along ideological lines.
Growing shares of Democrats also say the Supreme Court has a conservative tilt: 67% said this in August, up from 57% in January. And about half of Democrats (51%) said in August that the justices on the court are doing a poor job of keeping their own political views out of their judgments on major cases, nearly double the share who said this in January (26%).
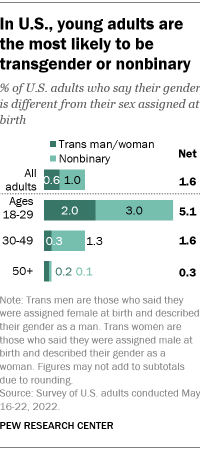
About 5% of Americans younger than 30 are transgender or nonbinary – that is, their gender is different from their sex assigned at birth, according to a survey conducted in May. By comparison, 1.6% of those ages 30 to 49 and 0.3% of those 50 and older say that their gender is different from their sex assigned at birth. Overall, 1.6% of U.S. adults are transgender or nonbinary – that is, someone who is neither a man nor a woman or isn’t strictly one or the other.
While a relatively small share of U.S. adults are transgender or nonbinary, many say they know someone who is. More than four-in-ten (44%) say they personally know someone who is trans and 20% know someone who is nonbinary. The share of adults who know someone who is transgender has increased from 42% in 2021 and from 37% in 2017.
In focus groups with trans and nonbinary adults, most participants said they knew from an early age – many as young as preschool or elementary school – that there was something different about them, even if they didn’t have the words to describe what it was.
Most Americans say journalists should always strive to give every side equal coverage, but journalists themselves are more likely to say every side does not always deserve equal coverage, according to two separate surveys conducted in late winter amid debate over “bothsidesism” in the media.
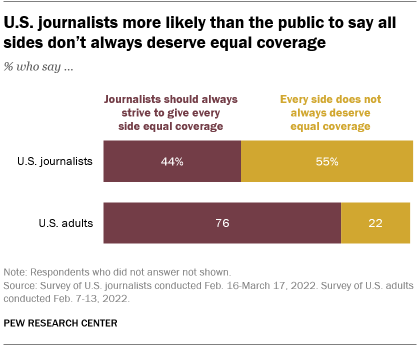
Among Americans overall, 76% say journalists should always strive to give all sides equal coverage, while 22% say every side does not always deserve equal coverage. The balance of opinion is reversed among journalists themselves: A little more than half (55%) say every side does not always deserve equal coverage, while 44% say journalists should always strive to give every side equal coverage.
This issue gained new intensity during Donald Trump’s presidency and the widespread disinformation and competing views surrounding the 2020 election and the COVID-19 pandemic. Those who favor equal coverage argue that it’s always necessary to allow the public to be equally informed about multiple sides of an argument, while those who disagree contend that people making false statements or unsupported conjectures do not warrant as much attention as those making factual statements with solid supporting evidence.
A recent surge in U.S. drug overdose deaths has hit Black men the hardest, a January analysis found. While overdose death rates have increased in every major demographic group in recent years, no group has seen a bigger increase than Black men. As a result, Black men have overtaken White men and are now on par with American Indian or Alaska Native men as the demographic groups most likely to die from overdoses.
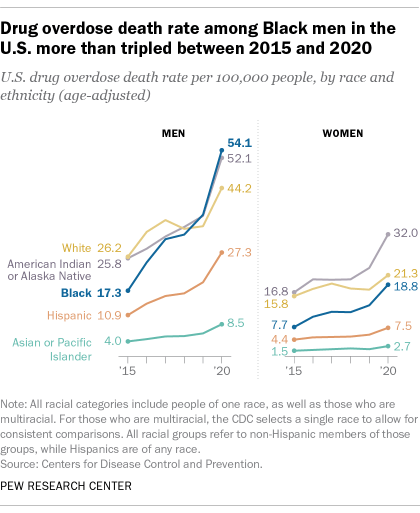
Nearly 92,000 Americans died of drug overdoses in 2020, up from around 70,000 in 2017. During the same period, the rate of fatal overdoses rose from 21.7 to 28.3 per 100,000 people.
Despite these increases, the share of Americans who say drug addiction is a major problem in their local community declined by 7 percentage points in subsequent surveys – from 42% in 2018 to 35% in 2021. And in a separate survey in early 2022, dealing with drug addiction ranked lowest out of 18 priorities for the president and Congress to address this year.
Nearly half of U.S. teens now say they use the internet “almost constantly,” according to a survey conducted in April and May. This percentage has roughly doubled since 2014-15, when 24% said they were almost constantly online.
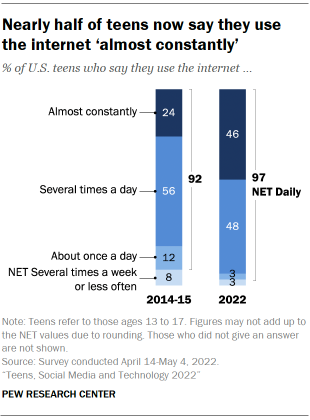
Black and Hispanic teens stand out for being on the internet more frequently than White teens. Some 56% of Black teens and 55% of Hispanic teens say they are online almost constantly, compared with 37% of White teens. (There were not enough Asian American teens in the sample to analyze separately.)
Older teens are also more likely to be online almost constantly. About half of 15- to 17-year-olds (52%) say they use the internet almost constantly, while 36% of 13- to 14-year-olds say the same. And 53% of urban teens report doing this, compared with somewhat smaller shares of suburban and rural teens (44% and 43%, respectively).
Since 2014-15, there has been a 22-point rise in the share of teens who report having access to a smartphone (from 73% then to 95% now). While teens’ access to smartphones has increased, their access to other digital technologies, such as desktop or laptop computers or gaming consoles, has remained statistically unchanged.
The share of aggregate U.S. household income held by the middle class has fallen steadily since 1970, according to an analysis published in April.
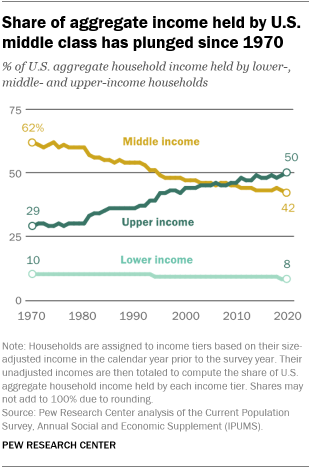
In 1970, adults in middle-income households accounted for 62% of aggregate income, a share that fell to 42% by 2020. Meanwhile, the share of aggregate income held by upper-income households has increased steadily, from 29% in 1970 to 50% in 2020. Part of this increase reflects the rising share of adults who are in the upper-income tier; another part reflects more rapid growth in earnings for these adults.
The share of U.S. aggregate income held by lower-income households edged down from 10% to 8% over these five decades, even though the proportion of adults living in lower-income households increased over this period.
Growing shares of both Republicans and Democrats say that members of the other party are more immoral, dishonest and closed-minded than other Americans, according to a survey conducted in June and July.
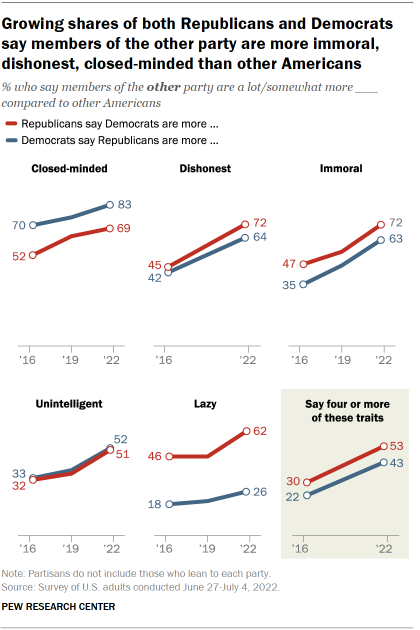
The percentage of Americans who view the people in the opposing political party in a negative light has increased in recent years. In 2016, 47% of Republicans and 35% of Democrats said those in the other party were a lot or somewhat more immoral than other Americans. Today, 72% of Republicans regard Democrats as more immoral than other Americans, and 63% of Democrats say the same about Republicans. Similar patterns exist when it comes to seeing members of the other party as more dishonest, closed-minded and unintelligent than other Americans.
There is one negative trait that Republicans are far more likely than Democrats to link to their political opponents. A 62% majority of Republicans say Democrats are “more lazy” than other Americans, up from 46% in both 2019 and 2016.
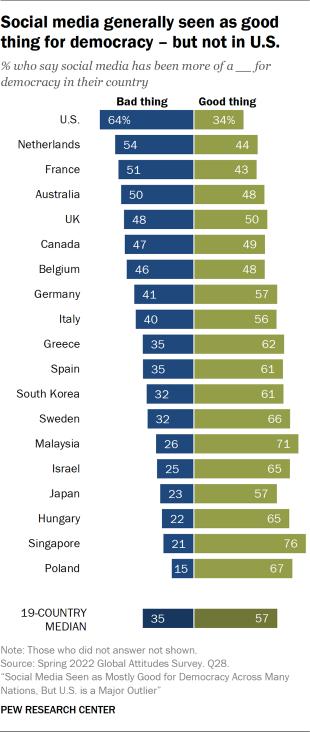
Majorities in nations around the world generally see social media as a good thing for democracy – but not in the United States, a survey of people in 19 advanced economies found.
Americans are the most negative about the impact of social media on democracy: 64% say it has been bad. Republicans are much more likely than Democrats (74% vs. 57%) to see the ill effects of social media on the political system.
In addition to being the most negative about social media’s influence on democracy, Americans are consistently among the most negative in their assessments of specific ways that social media has affected politics and society. For example, 79% in the U.S. believe access to the internet and social media has made people more divided in their political opinions, the highest percentage among the countries polled.
