Political candidates around the United States have released thousands of ads focusing on violent crime this year, and most registered voters see the issue as very important in the Nov. 8 midterm elections. But official statistics from the federal government paint a complicated picture when it comes to recent changes in the U.S. violent crime rate.
With Election Day approaching, here’s a closer look at voter attitudes about violent crime, as well as an analysis of the nation’s violent crime rate itself. All findings are drawn from Center surveys and the federal government’s two primary measures of crime: a large annual survey from the Bureau of Justice Statistics (BJS) and an annual study of local police data from the Federal Bureau of Investigation (FBI).
This Pew Research Center analysis examines the importance of violent crime as a voting issue in this year’s congressional elections and provides the latest available government data on the nation’s violent crime rate in recent years.
The public opinion data in this analysis is based on a Center survey of 5,098 U.S. adults, including 3,993 registered voters, conducted Oct. 10-16, 2022. Everyone who took part is a member of the Center’s American Trends Panel (ATP), an online survey panel that is recruited through national, random sampling of residential addresses. This way, nearly all U.S. adults have a chance of selection. The survey is weighted to be representative of the U.S. adult population by gender, race, ethnicity, partisan affiliation, education and other categories. Read more about the ATP’s methodology. Here are the questions used in the survey, along with responses, and its methodology.
The government crime statistics cited here come from the National Crime Victimization Survey, published by the Bureau of Justice Statistics, and the National Incident-Based Reporting System, published by the Federal Bureau of Investigation. For both studies, 2021 is the most recent year with available data.
Around six-in-ten registered voters (61%) say violent crime is very important when making their decision about who to vote for in this year’s congressional elections. Violent crime ranks alongside energy policy and health care in perceived importance as a midterm issue, but far below the economy, according to the Center’s October survey.
Republican voters are much more likely than Democratic voters to see violent crime as a key voting issue this year. Roughly three-quarters of Republican and GOP-leaning registered voters (73%) say violent crime is very important to their vote, compared with around half of Democratic or Democratic-leaning registered voters (49%).
Conservative Republican voters are especially focused on the issue: About eight-in-ten (77%) see violent crime as very important to their vote, compared with 63% of moderate or liberal Republican voters, 65% of moderate or conservative Democratic voters and only about a third of liberal Democratic voters (34%).
Older voters are far more likely than younger ones to see violent crime as a key election issue. Three-quarters of registered voters ages 65 and older say violent crime is a very important voting issue for them this year, compared with fewer than half of voters under 30 (44%).
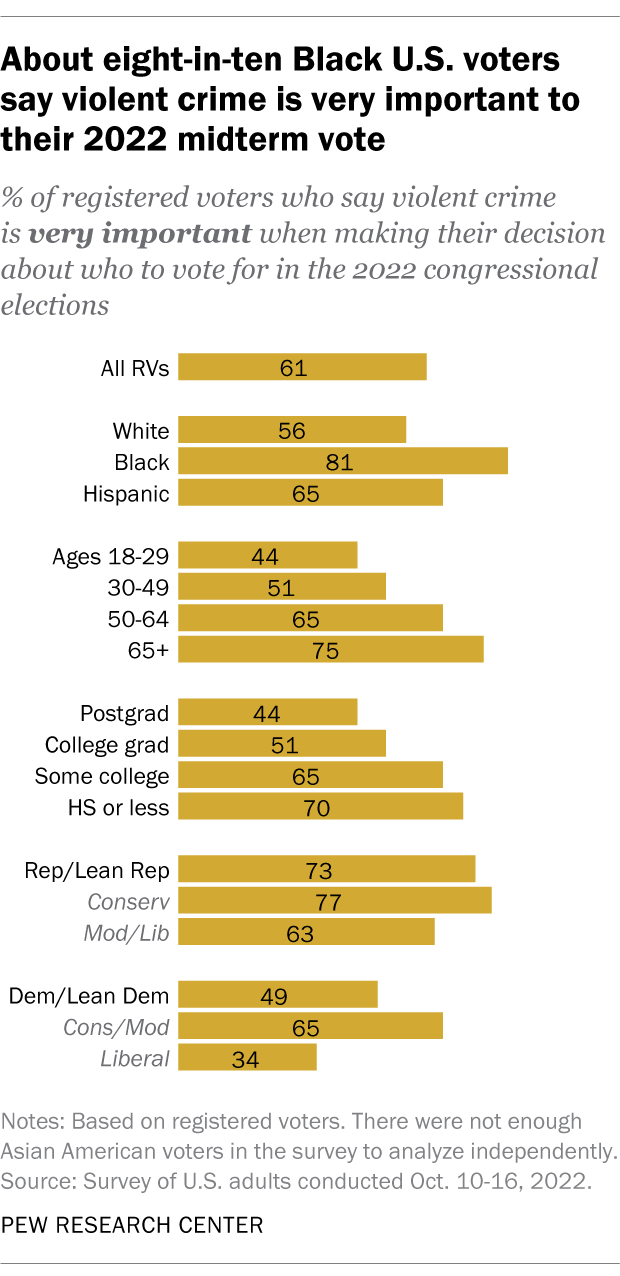
There are other demographic differences, too. When it comes to education, for example, voters without a college degree are substantially more likely than voters who have graduated from college to say violent crime is very important to their midterm vote.
Black voters are particularly likely to say violent crime is a very important midterm issue. Black Americans have consistently been more likely than other racial and ethnic groups to express concern about violent crime, and that remains the case this year.
Some 81% of Black registered voters say violent crime is very important to their midterm vote, compared with 65% of Hispanic and 56% of White voters. (There were not enough Asian American voters in the Center’s survey to analyze independently.)
Differences by race are especially pronounced among Democratic registered voters. While 82% of Black Democratic voters say violent crime is very important to their vote this year, only a third of White Democratic voters say the same.
Annual government surveys from the Bureau of Justice Statistics show no recent increase in the U.S. violent crime rate. In 2021, the most recent year with available data, there were 16.5 violent crimes for every 1,000 Americans ages 12 and older. That was statistically unchanged from the year before, below pre-pandemic levels and far below the rates recorded in the 1990s, according to the National Crime Victimization Survey.
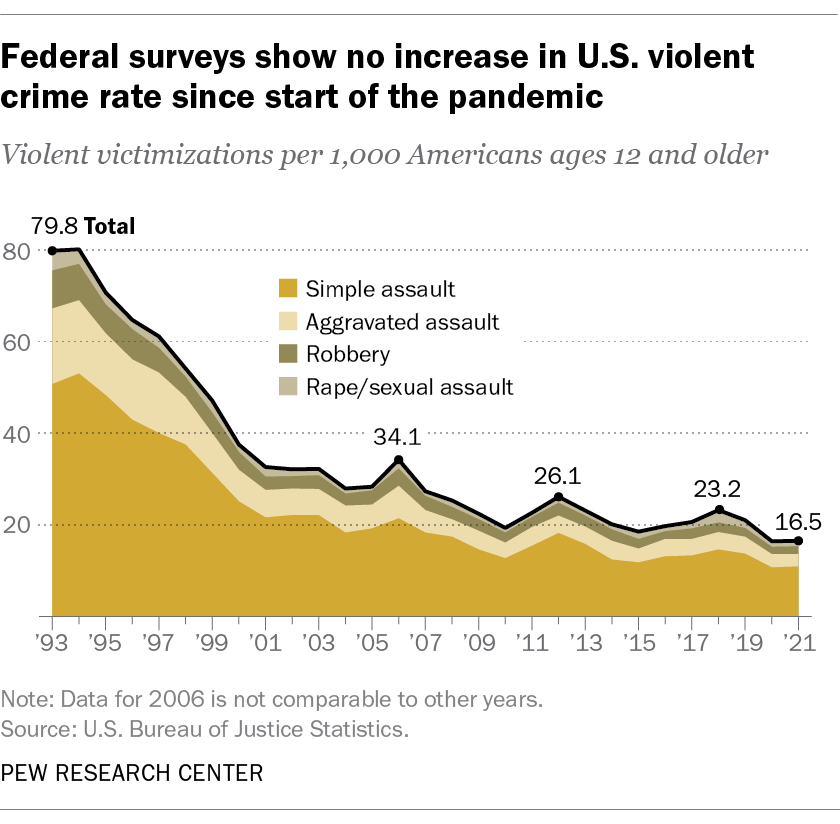
For each of the four violent crime types tracked in the survey – simple assault, aggravated assault, robbery and rape/sexual assault – there was no statistically significant increase either in 2020 or 2021.
The National Crime Victimization Survey is fielded each year among approximately 240,000 Americans ages 12 and older and asks them to describe any recent experiences they have had with crime. The survey counts threatened, attempted and completed crimes, whether or not they were reported to police. Notably, it does not track the most serious form of violent crime, murder, because it is based on interviews with surviving crime victims.
The FBI also estimates that there was no increase in the violent crime rate in 2021. The other major government study of crime in the U.S., the National Incident-Based Reporting System from the Federal Bureau of Investigation, uses a different methodology from the BJS survey and only tracks crimes that are reported to police.
The most recent version of the FBI study shows no rise in the national violent crime rate between 2020 and 2021. That said, there is considerable uncertainty around the FBI’s figures for 2021 because of a transition to a new data collection system. The FBI reported an increase in the violent crime rate between 2019 and 2020, when the previous data collection system was still in place.
The FBI estimates the violent crime rate by tracking four offenses that only partly overlap with those tracked by the National Crime Victimization Survey: murder and non-negligent manslaughter, rape, aggravated assault and robbery. It relies on data voluntarily submitted by thousands of local police departments, but many law enforcement agencies do not participate.
In the latest FBI study, around four-in-ten police departments – including large ones such as the New York Police Department – did not submit data, so the FBI estimated data for those areas. The high nonparticipation rate is at least partly due to the new reporting system, which asks local police departments to submit far more information about each crime than in the past. The new reporting system also makes it difficult to compare recent data with data from past years.
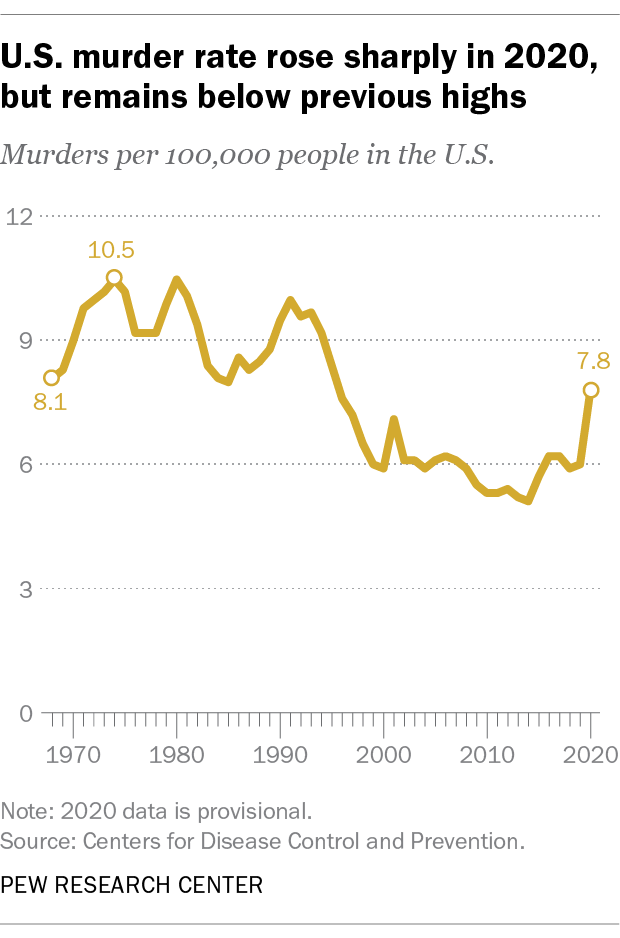
While the total U.S. violent crime rate does not appear to have increased recently, the most serious form of violent crime – murder – has risen significantly during the pandemic. Both the FBI and the Centers for Disease Control and Prevention (CDC) reported a roughly 30% increase in the U.S. murder rate between 2019 and 2020, marking one of the largest year-over-year increases ever recorded. The FBI’s latest data, as well as provisional data from the CDC, suggest that murders continued to rise in 2021.
Despite the increase in the nation’s murder rate in 2020, the rate remained well below past highs, and murder remains the least common type of violent crime overall.
There are many reasons why voters might be concerned about violent crime, even if official statistics do not show an increase in the nation’s total violent crime rate. One important consideration is that official statistics for 2022 are not yet available. Voters might be reacting to an increase in violent crime that has yet to surface in annual government reports. Some estimates from nongovernmental organizations do point to an increase in certain kinds of violent crime in 2022: For example, the Major Cities Chiefs Association, an organization of police executives representing large cities, estimates that robberies and aggravated assaults increased in the first six months of this year compared with the same period the year before.
Voters also might be thinking of specific kinds of violent crime – such as murder, which has risen substantially – rather than the total violent crime rate, which is an aggregate measure that includes several different crime types, such as assault and robbery.
Some voters could be reacting to conditions in their own communities rather than at the national level. Violent crime is a heavily localized phenomenon, and the national violent crime rate may not reflect conditions in Americans’ own neighborhoods.
Media coverage could affect voters’ perceptions about violent crime, too, as could public statements from political candidates and elected officials. Republican candidates, in particular, have emphasized crime on the campaign trail this year.
More broadly, the public often tends to believe that crime is up, even when the data shows it is down. In 22 of 26 Gallup surveys conducted since 1993, at least six-in-ten U.S. adults said there was more crime nationally than there was the year before, despite the general downward trend in the national violent crime rate during most of that period.
