
Around 44,000 people died of gun-related injuries in the United States in 2024, according to the latest available statistics from the Centers for Disease Control and Prevention (CDC). The number of gun deaths fell for the third consecutive year but was still among the highest annual totals on record.
Here are answers to some common questions about gun deaths in the U.S., based on a Pew Research Center analysis of data from the CDC, the FBI and other sources. You can also read our public opinion findings about U.S. gun violence and gun policy.
- How many people die from gun-related injuries in the U.S. each year?
- What share of U.S. gun deaths are homicides? What share are suicides?
- What share of all homicides and suicides in the U.S. involve a gun?
- How has the number of U.S. gun deaths changed over time?
- How has the rate of U.S. gun deaths changed over time?
- Which states have the highest and lowest gun death rates in the U.S.?
- How does the U.S. compare with other countries on gun deaths?
- How many people are killed in mass shootings in the U.S. every year?
- How has the number of mass shootings in the U.S. changed over time?
- Which types of firearms are most commonly used in gun murders in the U.S.?
How many people die from gun-related injuries in the U.S. each year?
In 2024, the most recent year with complete data, 44,447 people died from gun-related injuries, according to the CDC. That figure includes gun homicides and gun suicides, along with three less common types of gun-related deaths the CDC tracks: those that involved law enforcement, those that were accidental and those with undetermined circumstances.
The total excludes deaths in which gunshot injuries played a contributing, but not principal, role. (CDC fatality statistics are based on information from official death certificates, which identify a single cause of death.)
What share of U.S. gun deaths are homicides? What share are suicides?

| Type | Percent |
|---|---|
| Suicide | 62% |
| Other | 3% |
| Homicide | 35% |
Though they tend to get less public attention than gun-related homicides, suicides have long accounted for the majority of U.S. gun deaths. In 2024, 62% of all gun-related deaths in the U.S. were suicides (27,593), while 35% were homicides (15,364). The rest involved law enforcement (636), were accidental (450) or had undetermined circumstances (404); each of these categories accounted for around 1% of all gun deaths, according to CDC data.
What share of all homicides and suicides in the U.S. involve a gun?
In 2024, 76% of all U.S. homicides (15,364 of 20,162) involved a firearm. That was down a bit from other recent years, but still among the highest percentages since 1968 – the earliest year for which the CDC has online records.
In addition, 57% of all suicides in 2024 (27,593 of 48,824) involved a gun. That was higher than in recent years, but below the peak of 61% in both 1993 and 1990.
How has the number of U.S. gun deaths changed over time?

| Year | Suicide | Homicide |
|---|---|---|
| 1968 | 10,911 | 9,425 |
| 1969 | 11,304 | 10,174 |
| 1970 | 11,772 | 11,213 |
| 1971 | 12,288 | 12,423 |
| 1972 | 13,348 | 13,382 |
| 1973 | 13,317 | 13,752 |
| 1974 | 14,345 | 14,737 |
| 1975 | 14,873 | 14,295 |
| 1976 | 14,728 | 12,766 |
| 1977 | 16,084 | 12,874 |
| 1978 | 15,387 | 13,386 |
| 1979 | 15,543 | 14,491 |
| 1980 | 15,396 | 15,500 |
| 1981 | 16,139 | 15,089 |
| 1982 | 16,560 | 13,830 |
| 1983 | 16,600 | 12,040 |
| 1984 | 17,113 | 11,815 |
| 1985 | 17,363 | 11,836 |
| 1986 | 18,153 | 13,029 |
| 1987 | 18,136 | 12,657 |
| 1988 | 18,169 | 13,645 |
| 1989 | 18,178 | 14,464 |
| 1990 | 18,885 | 16,218 |
| 1991 | 18,526 | 17,746 |
| 1992 | 18,169 | 17,488 |
| 1993 | 18,940 | 18,253 |
| 1994 | 18,765 | 17,527 |
| 1995 | 18,503 | 15,551 |
| 1996 | 18,166 | 14,037 |
| 1997 | 17,566 | 13,252 |
| 1998 | 17,424 | 11,798 |
| 1999 | 16,599 | 10,828 |
| 2000 | 16,586 | 10,801 |
| 2001 | 16,869 | 11,348 |
| 2002 | 17,108 | 11,829 |
| 2003 | 16,907 | 11,920 |
| 2004 | 16,750 | 11,624 |
| 2005 | 17,002 | 12,352 |
| 2006 | 16,883 | 12,791 |
| 2007 | 17,352 | 12,632 |
| 2008 | 18,223 | 12,179 |
| 2009 | 18,735 | 11,493 |
| 2010 | 19,392 | 11,078 |
| 2011 | 19,990 | 11,068 |
| 2012 | 20,666 | 11,622 |
| 2013 | 21,175 | 11,208 |
| 2014 | 21,386 | 11,008 |
| 2015 | 22,018 | 12,979 |
| 2016 | 22,938 | 14,415 |
| 2017 | 23,854 | 14,542 |
| 2018 | 24,432 | 13,958 |
| 2019 | 23,941 | 14,414 |
| 2020 | 24,292 | 19,384 |
| 2021 | 26,328 | 20,958 |
| 2022 | 27,032 | 19,651 |
| 2023 | 27,300 | 17,927 |
| 2024 | 27,593 | 15,364 |
The 44,447 gun deaths in 2024 were the fifth-highest total on record since 1968, trailing only the four previous years.
- Gun homicides rose dramatically during the coronavirus pandemic but have declined substantially in more recent years. The number of gun homicides fell from a record 20,958 in 2021 to 15,364 in 2024, a 27% decrease.
- Gun suicides, on the other hand, have been on an upward trajectory for most of the last two decades. They peaked in 2024 with 27,593 such fatalities.
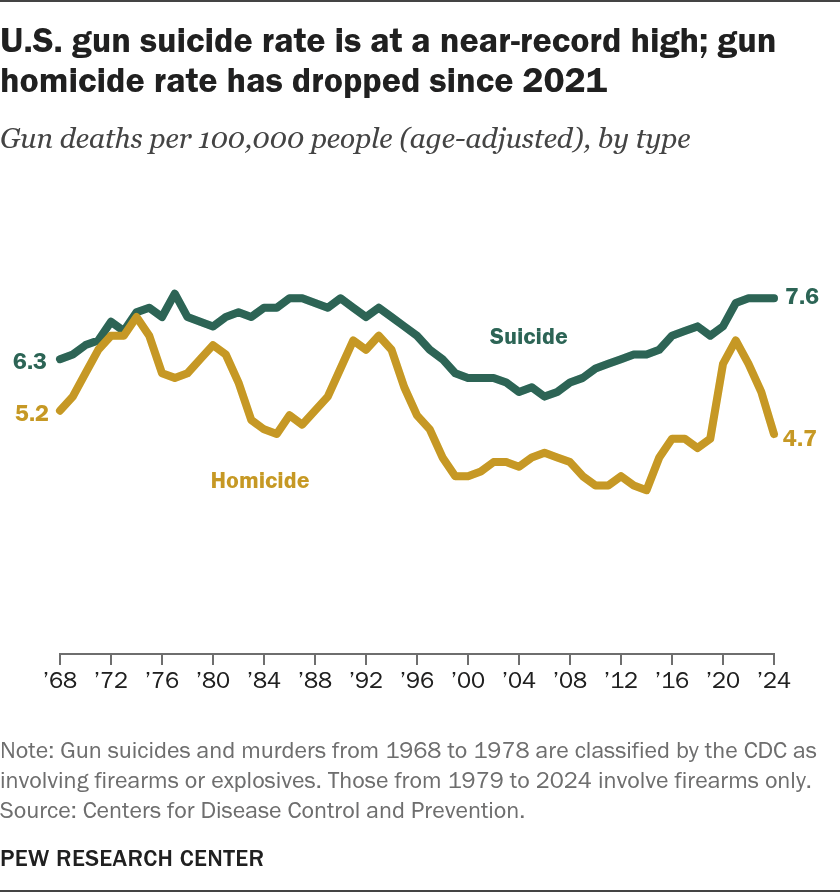
How has the rate of U.S. gun deaths changed over time?
While the overall number of gun deaths in the U.S. was among the highest on record in 2024, the nation’s population has also grown.
When adjusting for population growth over time, there were 12.8 gun deaths per 100,000 people in 2024. That was below the peak rate of 16.3 per 100,000 in 1974.
| Year | Suicide | Homicide |
|---|---|---|
| 1968 | 6.3 | 5.2 |
| 1969 | 6.4 | 5.5 |
| 1970 | 6.6 | 6.0 |
| 1971 | 6.7 | 6.5 |
| 1972 | 7.1 | 6.8 |
| 1973 | 6.9 | 6.8 |
| 1974 | 7.3 | 7.2 |
| 1975 | 7.4 | 6.8 |
| 1976 | 7.2 | 6.0 |
| 1977 | 7.7 | 5.9 |
| 1978 | 7.2 | 6.0 |
| 1979 | 7.1 | 6.3 |
| 1980 | 7.0 | 6.6 |
| 1981 | 7.2 | 6.4 |
| 1982 | 7.3 | 5.8 |
| 1983 | 7.2 | 5.0 |
| 1984 | 7.4 | 4.8 |
| 1985 | 7.4 | 4.7 |
| 1986 | 7.6 | 5.1 |
| 1987 | 7.6 | 4.9 |
| 1988 | 7.5 | 5.2 |
| 1989 | 7.4 | 5.5 |
| 1990 | 7.6 | 6.1 |
| 1991 | 7.4 | 6.7 |
| 1992 | 7.2 | 6.5 |
| 1993 | 7.4 | 6.8 |
| 1994 | 7.2 | 6.5 |
| 1995 | 7.0 | 5.7 |
| 1996 | 6.8 | 5.1 |
| 1997 | 6.5 | 4.8 |
| 1998 | 6.3 | 4.2 |
| 1999 | 6.0 | 3.8 |
| 2000 | 5.9 | 3.8 |
| 2001 | 5.9 | 3.9 |
| 2002 | 5.9 | 4.1 |
| 2003 | 5.8 | 4.1 |
| 2004 | 5.6 | 4.0 |
| 2005 | 5.7 | 4.2 |
| 2006 | 5.5 | 4.3 |
| 2007 | 5.6 | 4.2 |
| 2008 | 5.8 | 4.1 |
| 2009 | 5.9 | 3.8 |
| 2010 | 6.1 | 3.6 |
| 2011 | 6.2 | 3.6 |
| 2012 | 6.3 | 3.8 |
| 2013 | 6.4 | 3.6 |
| 2014 | 6.4 | 3.5 |
| 2015 | 6.5 | 4.2 |
| 2016 | 6.8 | 4.6 |
| 2017 | 6.9 | 4.6 |
| 2018 | 7.0 | 4.4 |
| 2019 | 6.8 | 4.6 |
| 2020 | 7.0 | 6.2 |
| 2021 | 7.5 | 6.7 |
| 2022 | 7.6 | 6.2 |
| 2023 | 7.6 | 5.6 |
| 2024 | 7.6 | 4.7 |
- The gun homicide rate fell to 4.7 fatalities per 100,000 people in 2024, far below the peak rate of 7.2 per 100,000 in 1974.
- The gun suicide rate, by contrast, is on par with its all-time high. There were 7.6 gun suicides per 100,000 people in 2024 – about equal to the record 7.7 per 100,000 in 1977.
(One caveat when considering older figures from the CDC: Gun homicides and gun suicides between 1968 and 1978 are classified as those caused by firearms and explosives. In subsequent years, they are classified as deaths involving firearms only.)
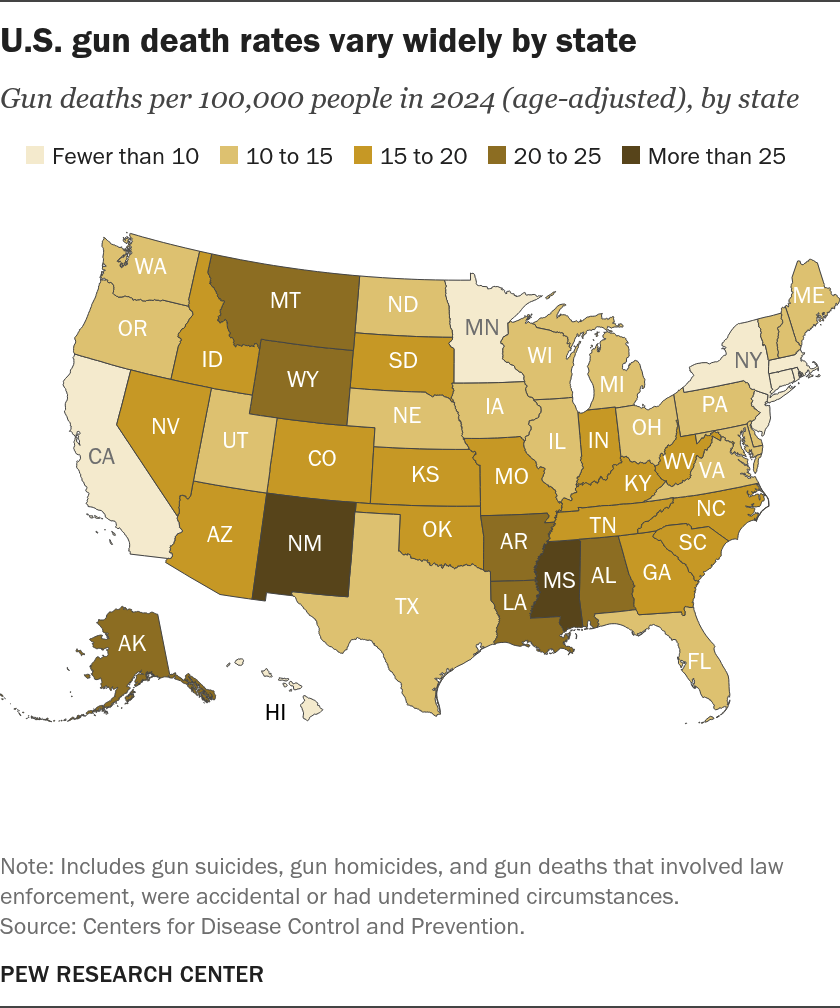
Which states have the highest and lowest gun death rates in the U.S.?
| FIPS | State | Gun deaths per 100,000 people in 2024 (age-adjusted) |
|---|---|---|
| 01 | Alabama | 23.7 |
| 02 | Alaska | 24.4 |
| 04 | Arizona | 16.9 |
| 05 | Arkansas | 20.6 |
| 06 | California | 7.0 |
| 08 | Colorado | 15.3 |
| 09 | Connecticut | 5.8 |
| 10 | Delaware | 11.8 |
| 11 | District of Columbia | 19.7 |
| 12 | Florida | 12.7 |
| 13 | Georgia | 17.6 |
| 15 | Hawaii | 3.7 |
| 16 | Idaho | 15.9 |
| 17 | Illinois | 12.4 |
| 18 | Indiana | 17.2 |
| 19 | Iowa | 11.8 |
| 20 | Kansas | 15.2 |
| 21 | Kentucky | 18.5 |
| 22 | Louisiana | 22.9 |
| 23 | Maine | 11.9 |
| 24 | Maryland | 11.6 |
| 25 | Massachusetts | 3.8 |
| 26 | Michigan | 11.9 |
| 27 | Minnesota | 9.8 |
| 28 | Mississippi | 28.0 |
| 29 | Missouri | 19.6 |
| 30 | Montana | 20.2 |
| 31 | Nebraska | 10.9 |
| 32 | Nevada | 17.2 |
| 33 | New Hampshire | 10.2 |
| 34 | New Jersey | 4.0 |
| 35 | New Mexico | 26.6 |
| 36 | New York | 4.4 |
| 37 | North Carolina | 16.3 |
| 38 | North Dakota | 12.2 |
| 39 | Ohio | 14.6 |
| 40 | Oklahoma | 19.1 |
| 41 | Oregon | 14.2 |
| 42 | Pennsylvania | 11.9 |
| 44 | Rhode Island | 4.6 |
| 45 | South Carolina | 19.5 |
| 46 | South Dakota | 17.3 |
| 47 | Tennessee | 19.8 |
| 48 | Texas | 13.9 |
| 49 | Utah | 13.3 |
| 50 | Vermont | 10.6 |
| 51 | Virginia | 12.8 |
| 53 | Washington | 11.0 |
| 54 | West Virginia | 15.3 |
| 55 | Wisconsin | 12.1 |
| 56 | Wyoming | 23.4 |
The rate of gun fatalities varies widely from state to state. In 2024, the states with the highest total rates of gun-related deaths – counting homicides, suicides and all other categories the CDC tracks – included Mississippi (28.0 per 100,000 people), New Mexico (26.6), Alaska (24.4), Alabama (23.7) and Wyoming (23.4).
The states with the lowest total rates included Hawaii (3.7), Massachusetts (3.8), New Jersey (4.0), New York (4.4) and Rhode Island (4.6).
The results are somewhat different when looking at gun homicide and suicide rates separately:
- The places with the highest gun homicide rates in 2024 included the District of Columbia (18.0 per 100,000 people), Mississippi (16.9), Louisiana (13.0), Alabama (11.6) and New Mexico (10.3).
- The lowest gun homicide rates were in New Hampshire (0.9), Maine (1.2), Rhode Island (1.2), Idaho (1.3) and North Dakota (1.3).
- The states with the highest gun suicide rates in 2024 included Wyoming (19.7 per 100,000 people), Alaska (18.7), Montana (16.9), New Mexico (14.3) and Idaho (13.7).
- The lowest gun suicide rates were in D.C. (1.5), Hawaii (1.9), New Jersey (2.1), Massachusetts (2.3) and New York (2.3).
These rates are adjusted to account for age differences across states. Adjusting for age is important because some states have older populations than others and mortality patterns vary widely by age.
How does the U.S. compare with other countries on gun deaths?
In absolute numbers, the U.S. has far more gun deaths than any other country, according to data collected by the Institute for Health Metrics and Evaluation (IHME) at the University of Washington. The data, which covers 204 countries and territories, includes gun deaths caused by “physical violence” and “self-harm,” as well as unintentional gun deaths. (This analysis counts gun deaths caused by physical violence as homicides and those caused by self-harm as suicides. All rates below are adjusted to account for age differences across countries and territories.)

| Country/territory | Gun death rate per 100,000 people in 2023 (age-adjusted) |
|---|---|
| Venezuela | 45.8 |
| El Salvador | 40.4 |
| Haiti | 31.3 |
| Colombia | 21.7 |
| Puerto Rico | 20.5 |
| Ecuador | 20.0 |
| Mexico | 19.8 |
| Guatemala | 19.8 |
| Honduras | 18.8 |
| Trinidad and Tobago | 18.7 |
| Jamaica | 17.7 |
| Brazil | 17.4 |
| United States | 13.2 |
| Panama | 12.1 |
| Iraq | 12.1 |
In 2023, the most recent year with global data, the U.S. had about 10,000 more total gun deaths than the country with the next-highest total, Brazil. It was among the top countries for both gun homicides and suicides:
- The U.S. trailed only Brazil and Mexico in gun homicides in 2023.
- It led the world in the number of gun suicides that year.
Of course, the U.S. is also among the most populous countries in the world. When looking at the rate of gun deaths per 100,000 people – which adjusts for population differences between countries – the U.S. ranked below several other places in 2023. Its gun death rate of 13.2 per 100,000 people was far below that of Venezuela (45.8) and El Salvador (40.4) and trailed several other Latin American nations, including Colombia (21.7), Ecuador (20.0), Mexico (19.8), Guatemala (19.8), Honduras (18.8) and Brazil (17.4).
- The U.S. gun homicide rate of 6.2 per 100,000 people was below that of more than two dozen other countries and territories in 2023, according to IHME.
- The U.S. gun suicide rate of 6.7 per 100,000 people was second only to Greenland, which had 21.2 such deaths per 100,000 people that year.
How many people are killed in mass shootings in the U.S. every year?
This is a difficult question to answer because there is no single, agreed-upon definition of the term “mass shooting.” Definitions can vary depending on factors including the number of victims and the circumstances of the shooting.
The FBI collects data on “active shooter incidents,” which it defines as “one or more individuals actively engaged in killing or attempting to kill people in a populated area.” Using the FBI’s definition, 23 people – excluding the shooters – died in such incidents in 2024.
The Gun Violence Archive, an online database of gun violence incidents in the U.S., defines mass shootings as incidents in which four or more people are shot, even if no one was killed (again excluding the shooters). Using this definition, 510 people died in these incidents in 2024.
Regardless of the definition used, mass shooting deaths are a small fraction of all gun homicides in the U.S. each year.
How has the number of mass shootings in the U.S. changed over time?
The same definitional issue that makes it challenging to calculate mass shooting fatalities comes into play when looking at mass shootings over time.

| Year | Active shooter incidents |
|---|---|
| 2000 | 3 |
| 2001 | 10 |
| 2002 | 7 |
| 2003 | 12 |
| 2004 | 5 |
| 2005 | 11 |
| 2006 | 12 |
| 2007 | 14 |
| 2008 | 9 |
| 2009 | 19 |
| 2010 | 27 |
| 2011 | 13 |
| 2012 | 21 |
| 2013 | 19 |
| 2014 | 20 |
| 2015 | 20 |
| 2016 | 20 |
| 2017 | 31 |
| 2018 | 30 |
| 2019 | 30 |
| 2020 | 40 |
| 2021 | 61 |
| 2022 | 50 |
| 2023 | 48 |
| 2024 | 24 |
The unpredictability of these incidents also complicates matters. As RAND noted in a research brief, “the relative rarity of these events makes analysis of trends particularly difficult.”
The FBI has found a decrease in active shooter incidents in recent years. There were 61 such incidents in 2021, 50 in 2022, 48 in 2023 and 24 in 2024.
Likewise, the Gun Violence Archive has found a generally downward trend in mass shootings during the same span, with 690 such incidents in 2021, 645 in 2022, 660 in 2023 and 502 in 2024.
Which types of firearms are most commonly used in gun murders in the U.S.?
The FBI found that in 2024:
- Handguns were involved in 53% of the 11,717 U.S. gun murders and nonnegligent manslaughters for which data is available.
- Rifles – the category that includes guns sometimes referred to as “assault weapons” – were involved in 3% of these deaths.
- Shotguns were involved in 1%.
- Other kinds of firearms or those classified as “type not stated” were involved in the remaining 42%.
It’s important to note that the FBI’s statistics do not capture the details of all gun murders in the U.S. each year. Its data is based on information submitted voluntarily by police departments around the country, and not all agencies participate or provide complete information each year.
Note: This is an update of a post originally published on Aug. 16, 2019.
