

After more than 50 years of rapid growth, the nation’s immigrant population is now in decline.
In January 2025, 53.3 million immigrants lived in the United States – the largest number ever recorded. In the ensuing months, however, more immigrants left the country or were deported than arrived. By June, the country’s foreign-born population had shrunk by more than a million people, marking its first decline since the 1960s.
A new Pew Research Center analysis of Census Bureau data finds that, as of June 2025:
- 51.9 million immigrants lived in the U.S.
- 15.4% of all U.S. residents were immigrants, down from a recent historic high of 15.8%.
- 19% of the U.S. labor force were immigrants, down from 20% and by over 750,000 workers since January.
Starting in mid-2024, several policy changes have affected the U.S. immigrant population:
- In June 2024, President Joe Biden announced new restrictions on asylum applications, leading to a sharp decline in border encounters with immigrants seeking asylum protections.
- In his first 100 days since returning to the White House in January, President Donald Trump took 181 executive actions on immigration to curtail the arrival of new immigrants and deport noncitizen immigrants. The full effects of these policies remain to be seen, but already they are contributing to a declining immigrant population – especially the unauthorized immigrant population.
Pew Research Center regularly publishes research on the U.S. immigrant population and international migration trends. Here are answers to some key questions about U.S. immigrants, based on the most recent detailed data available. (In some cases, this data is from mid-2023.)
- How many people in the U.S. are immigrants?
- Where are U.S. immigrants from?
- How have immigrants’ origins changed in recent years?
- How have immigration flows changed over the longer term?
- What is the legal status of immigrants in the U.S.?
- Who are unauthorized immigrants?
- Do all lawful immigrants choose to become U.S. citizens?
- How many immigrants are working in the U.S.?
- Where do most U.S. immigrants live?
- How educated are immigrants?
- How well do immigrants speak English?
How many people in the U.S. are immigrants?
As of June 2025, 51.9 million immigrants lived in the U.S., making up 15.4% of the nation’s population. This was down from January, when there were a record 53.3 million immigrants in the U.S., accounting for 15.8% of the country’s population – the highest percentage on record.
Even as the nation’s immigrant population has declined in recent months – a change that may be partly artificial due to a declining survey response rate among immigrants – the U.S. is home to more immigrants than any other country.

As of 2024, the second-largest immigrant population is in Germany, numbering around 17 million, according to the latest estimates from the United Nations.
While the U.S. is home to the largest number of immigrants, dozens of countries (including Germany) have a higher proportion of immigrants in their populations than the U.S. does. In neighboring Canada, for example, immigrants account for 22% of the population. And in the United Arab Emirates, about three-quarters of all residents were born elsewhere.
Where are U.S. immigrants from?
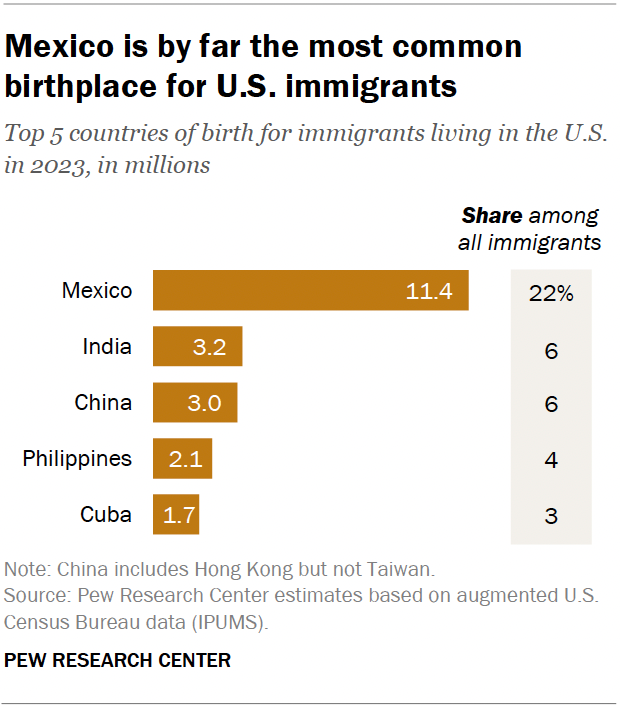
As of mid-2023 – the latest year for which detailed data is available – more than 11 million U.S. residents were born in Mexico, representing 22% of all immigrants nationally. The second-largest immigrant group was from India (3.2 million, or 6%), followed by China (3 million, or 6%), the Philippines (2.1 million, or 4%) and Cuba (1.7 million, or 3%).
About half of all U.S. immigrants (52%, or 26.7 million people) were born in Latin America. In addition to the millions of migrants from Mexico and Cuba, more than a million hail from El Salvador (1.6 million), Guatemala (1.4 million), the Dominican Republic (1.4 million), Colombia (1.2 million), Honduras (1.1 million) and Venezuela (1.1 million).
After Latin America, Asia is the second-largest region of birth for U.S. immigrants. In 2023, around a quarter of all immigrants (27%, or nearly 14 million people) were born in Asia.
As of 2023, there were about 11 million immigrants from every other world region combined, accounting for 22% of the U.S. foreign-born population: 10% were born in Europe, 5% in sub-Saharan Africa, 4% in the Middle East-North Africa region, and 2% in Canada or another North American country (a category that includes Bermuda and some smaller countries).
How have immigrants’ origins changed in recent years?
An unprecedented number of immigrants – more than 11 million – arrived in the U.S. between 2020 and 2025. That included more than 3 million in 2023 alone, the largest annual total ever recorded, according to a Center analysis of government data sources.
Alongside this increase, immigrants’ origin regions have also shifted, with a growing share coming from South America and Europe and a declining share coming from Asia and sub-Saharan Africa.
Between 2021 and 2023, 20% of newly arrived immigrants were from South America, up from 13% in the period between 2015 and 2019. Another 12% of new arrivals between 2021 and 2023 were from Europe or Canada, up from 9% in the earlier period.
At the same time, 24% of new arrivals between 2021 and 2023 were from South and East Asia, down from 29% in 2015-19. And 5% of new arrivals between 2021 and 2023 involved people from sub-Saharan Africa, down from 8% in 2015-19.
Mexico was the largest origin country for immigrants who arrived between 2021 and 2023. About 11% of immigrants who came to the U.S. during this period were born in Mexico. Rounding out the top five countries of origin for immigrants who arrived during this period were India (8%), Venezuela (7%), Cuba (6%) and Colombia (5%).
Throughout this period, unauthorized immigrants accounted for most new immigrant arrivals, with many coming from Central and South America.
How have immigration flows changed over the longer term?
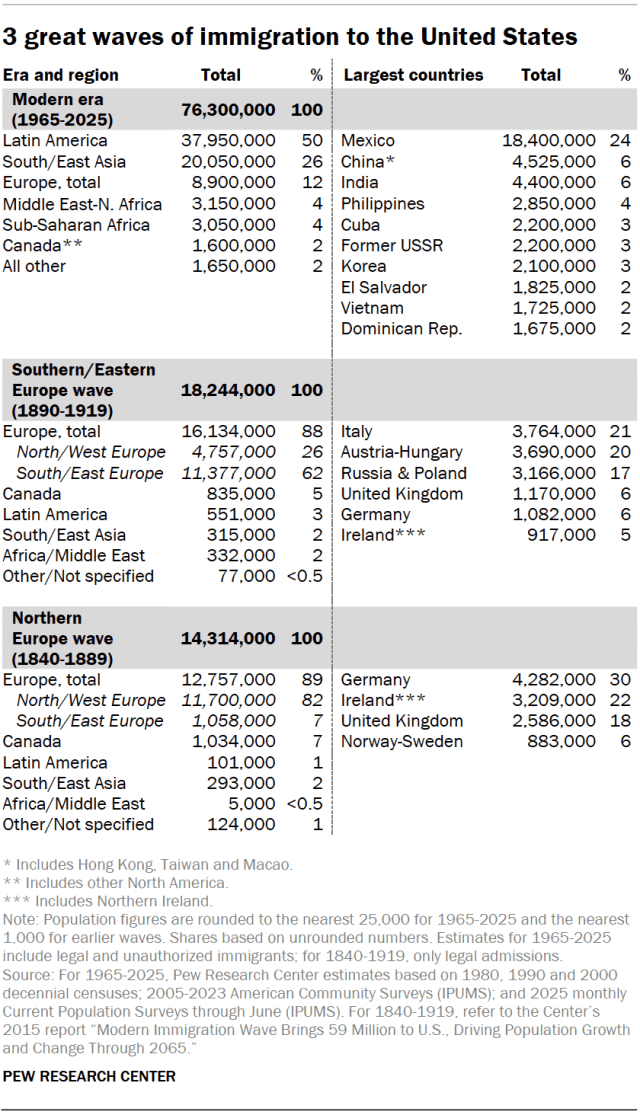
Since 1965, more than 76 million immigrants have come to the U.S.
Before then, U.S. immigration law favored immigrants from Northern and Western Europe and mostly barred immigration from Asia. The 1965 Immigration and Nationality Act opened up immigration from Asia and Latin America. The Immigration Act of 1990 further increased legal immigration and allowed immigrants from more countries to enter the U.S. legally.
Immigration flows after 1965 have been larger and come from different and more countries than earlier flows:
- From 1840 to 1889, about 90% of U.S. immigrants came from Europe, including about 70% from Germany, Ireland and the United Kingdom.
- Almost 90% of the immigrants who arrived from 1890 to 1919 also came from Europe. But their origins were largely different as nearly 60% came from Italy, Austria-Hungary and Russia-Poland.
- Since 1965, about half of U.S. immigrants have come from Latin America, with about a quarter from Mexico alone. About another quarter have come from Asia. Large numbers have come from China, India and the Philippines.
Today, Mexico remains the largest origin country among U.S. immigrants. However, immigration from Mexico has slowed since 2007, and the Mexican-born population in the U.S. has since dropped. The Mexican share of the U.S. immigrant population declined from 29% in 2010 to 22% in 2023.
What is the legal status of immigrants in the U.S.?
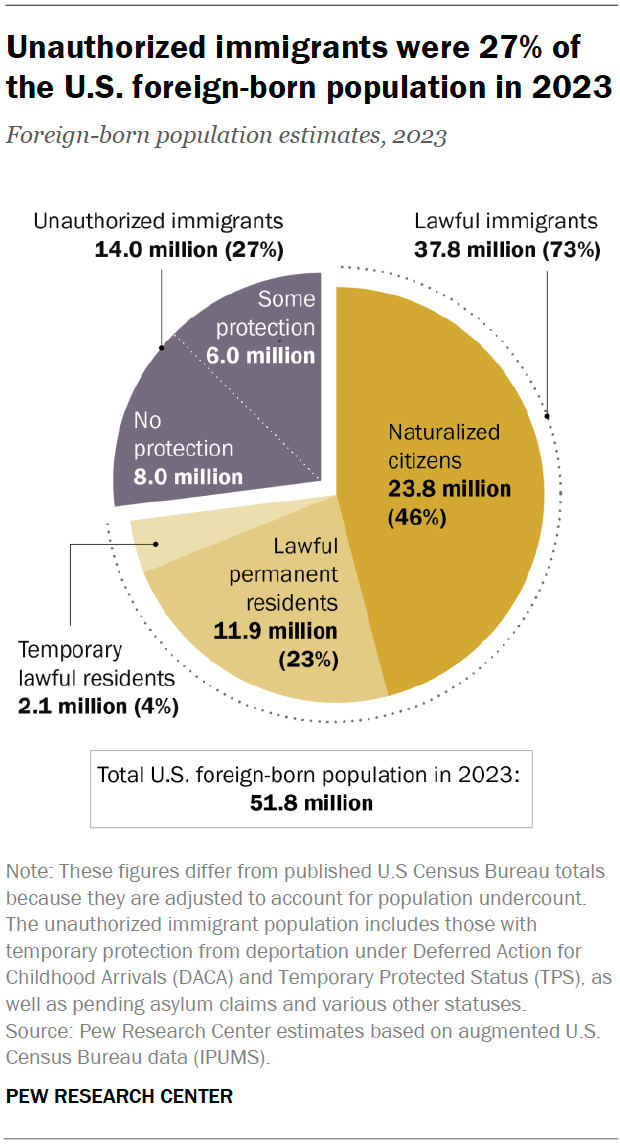
As of 2023, 46% of immigrants were naturalized U.S. citizens. Nearly a quarter (23%) were lawful permanent residents, often referred to as “green card holders,” and another 4% were lawful temporary residents who were permitted to stay in the U.S. for a limited period of time, usually for work or study. The remaining immigrants in the U.S. fell into the “unauthorized” category and constituted 27% of all U.S. immigrants.
Related: U.S. Unauthorized Immigrant Population Reached a Record
14 Million in 2023
Who are unauthorized immigrants?
Unauthorized immigrants are those without full legal status. As of 2023, this population hit a new record high of 14 million. Within this group, about 6 million (or a little more than 40%) had some form of temporary protection from deportation, with some also having a permit to work in the U.S.
Among the unauthorized immigrants with some deportation protections were 2.6 million asylum applicants; 700,000 people who entered the U.S. legally after receiving parole; 700,000 victims of crime and violence; 650,000 people with Temporary Protected Status (TPS), a program available to immigrants from countries facing war, natural disasters and other crises; and 600,000 immigrants who were brought to the U.S. illegally as children and are enrolled in the Deferred Action for Childhood Arrivals (DACA) program.
Another 1 million migrants encountered U.S. Border Patrol before being released into the U.S., typically with an order to appear in immigration court. These immigrants have had more limited protections from deportation while their cases are being resolved.
Immigrants in these groups are included as part of the “unauthorized” population because their deportation protections are temporary and can quickly change. For example, the Trump administration has rescinded deportation protections and work permits for about 500,000 immigrants from Cuba, Haiti, Nicaragua and Venezuela who entered the U.S. legally.
The remaining unauthorized immigrants in the U.S. as of 2023 (about 8 million) had neither legal status nor temporary protection from deportation.
This year, policy and enforcement changes likely contributed to a decline in the unauthorized immigrant population between January and June. Border crossings have fallen further, reaching lows not seen since the 1960s. Immigration arrests and deportations have increased. And a growing number of immigrants have lost deportation protections, with some likely leaving the country voluntarily.
Do all lawful immigrants choose to become U.S. citizens?
Immigrants who are lawful permanent residents and meet other requirements can apply to become U.S. citizens through the naturalization process. During the 2024 fiscal year, 818,500 immigrants became U.S. citizens through naturalization.
Millions of lawful permanent residents are currently eligible to become U.S. citizens but have not applied for naturalization.
How many immigrants are working in the U.S.?
Between January and June 2025, the number of immigrants living and working in the U.S. declined. But recent figures by legal status are not yet available.
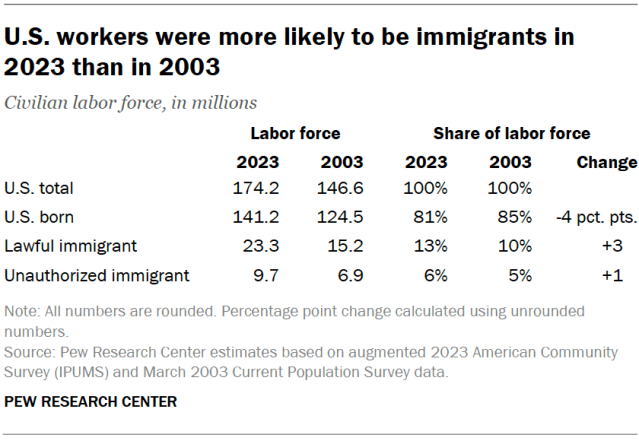
In 2023, the most recent year with complete data, 33 million immigrants were in the U.S. workforce, including about 23 million lawful immigrants and 10 million unauthorized immigrants.
Nearly one-in-five workers (19%) were immigrants in 2023, up from 15% two decades earlier. This share increased steadily since at least 1995, when they made up 12% of the labor force.
About 2% of adult immigrants, including noncitizens, are currently serving in the military or served in the past.
Where do most U.S. immigrants live?
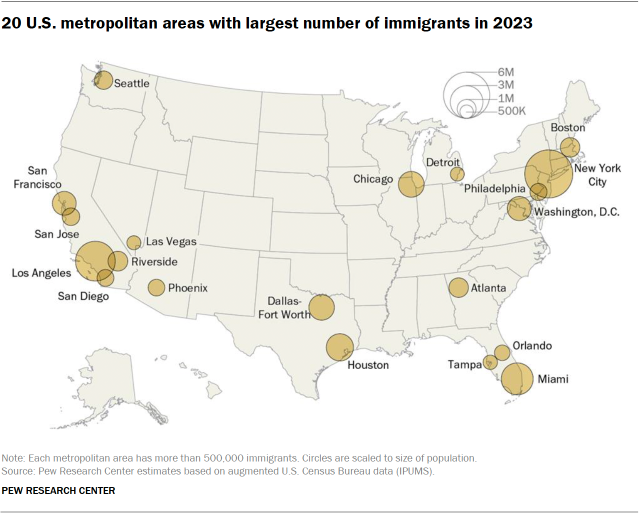
In 2023, most of the nation’s 51.8 million immigrants lived in just four states. California was home to 11.3 million immigrants, or 28.4% of the national total. Texas had the second-largest immigrant population with over 6 million foreign-born residents, followed by Florida (5.4 million) and New York (5.0 million).
A majority of immigrants lived in only 12 metropolitan areas. The New York City metropolitan area was home to the largest population, accounting for 13% of all immigrants. The Los Angeles and Miami metro areas also had particularly large immigrant populations, with 9% and 6% of all U.S. immigrants, respectively.
How educated are immigrants?
Overall, immigrants in the U.S. had lower levels of educational attainment than their U.S.-born counterparts in 2023.

- 24% of immigrant adults ages 25 and older had not completed high school, compared with 7% of the U.S.-born population.
- However, immigrants were as likely as the U.S. born to have a bachelor’s degree or higher (36% each).
Educational attainment among immigrants varies widely based on their region of origin:
- Only 11% of Central American immigrants hold a bachelor’s degree or higher. By comparison, 36% of U.S.-born adults have this level of education.
- Immigrants from Asia, Europe, the Middle East-North Africa region, sub-Saharan Africa and other North American countries are more likely than the U.S. born to have at least a bachelor’s degree.
How well do immigrants speak English?
About half of immigrants ages 5 and older (52%) are proficient English speakers, meaning they either speak English very well or speak only English at home.

Again, there is a wide range of English proficiency depending on where immigrants were born:
- The overwhelming majority of immigrants from elsewhere in North America (97%) or from Oceania (83%) – primarily Australia and New Zealand – are proficient English speakers.
- Large shares of immigrants from sub-Saharan Africa (75%), South Asia (72%) and Europe (72%) also are English proficient.
- On the opposite end of the spectrum, only about one-in-three immigrants who were born in Central America (31%) are proficient in English.
English proficiency is more common among immigrants who arrived in the U.S. before 2000 than among those who entered the country later. Some 57% of immigrants who came to the U.S. before 2000 are proficient English speakers, compared with 47% who arrived in 2010 or later.
Note: This is an update of an analysis originally published May 3, 2017.

