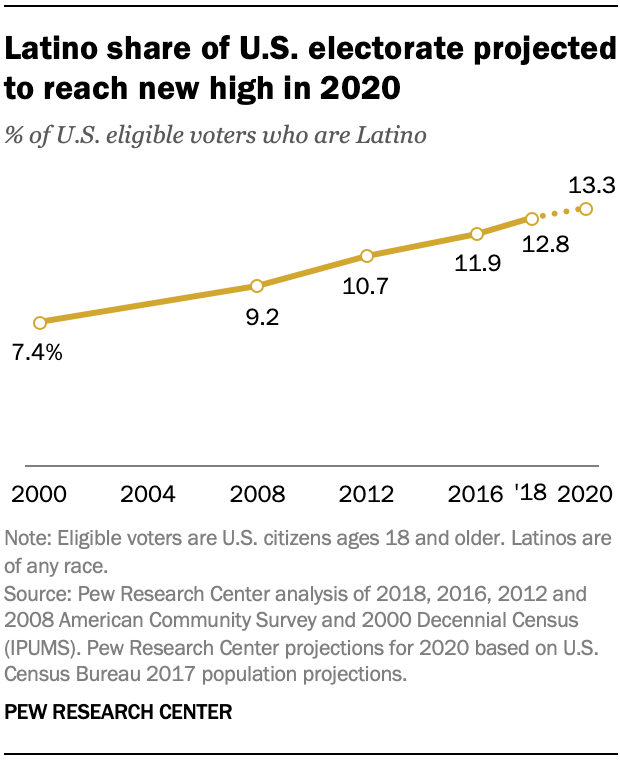
This year, Latinos are expected for the first time to be the nation’s largest racial or ethnic minority in a U.S. presidential election, with a record 32 million projected to be eligible to vote. They will account for 13.3% of all eligible voters. However, the number of Latino eligible voters is still far below the 60 million Latinos who live in the country. (Explore our interactive maps and tables to see Latino eligible voters by state and congressional district.)
Latino eligible voters – U.S. citizens ages 18 and older – could play a larger role in this year’s Democratic Party primary season. A majority (56%) live in states that will hold Democratic primaries and caucuses on or before Super Tuesday (March 3), up from 29% in 2016. Nationally, 62% of Latino registered voters identify with or lean toward the Democratic Party while 34% say the same about the Republican Party.
How we did this
For this project, we examined the geographic distribution of Latino eligible voters across states and congressional districts. The term “eligible voters” refer to persons ages 18 and older who are U.S. citizens. The analysis is based on microdata from the U.S. Census Bureau’s American Community Survey and the 2000 U.S. decennial census, all provided through Integrated Public Use Microdata Series (IPUMS) from the University of Minnesota.
Here are five facts about the geography of Latino voters for the upcoming 2020 presidential election:
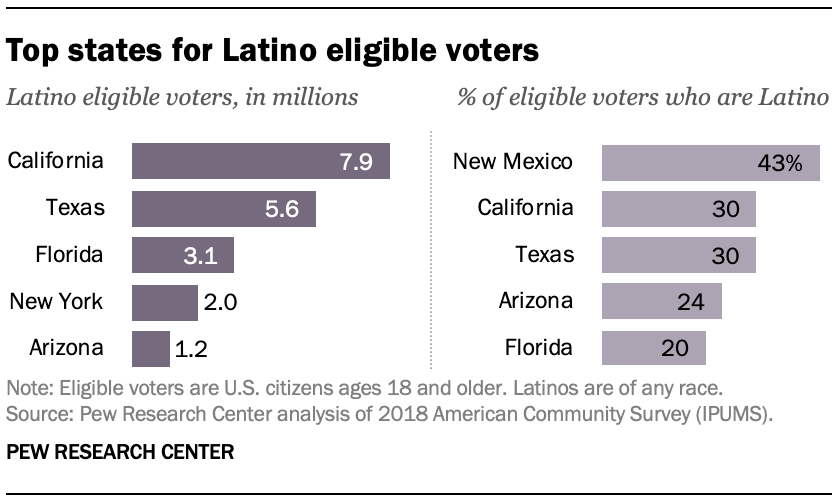
Two-in-three Latino eligible voters live in just five states. California alone holds roughly a quarter of the nation’s Latino electorate, with 7.9 million Latino eligible voters. Texas is second with 5.6 million, followed by Florida (3.1 million), New York (2.0 million) and Arizona (1.2 million).
Latinos make up the highest share of eligible voters in New Mexico (43%). The other top states are California (30%), Texas (30%), Arizona (24%) and Florida (20%).
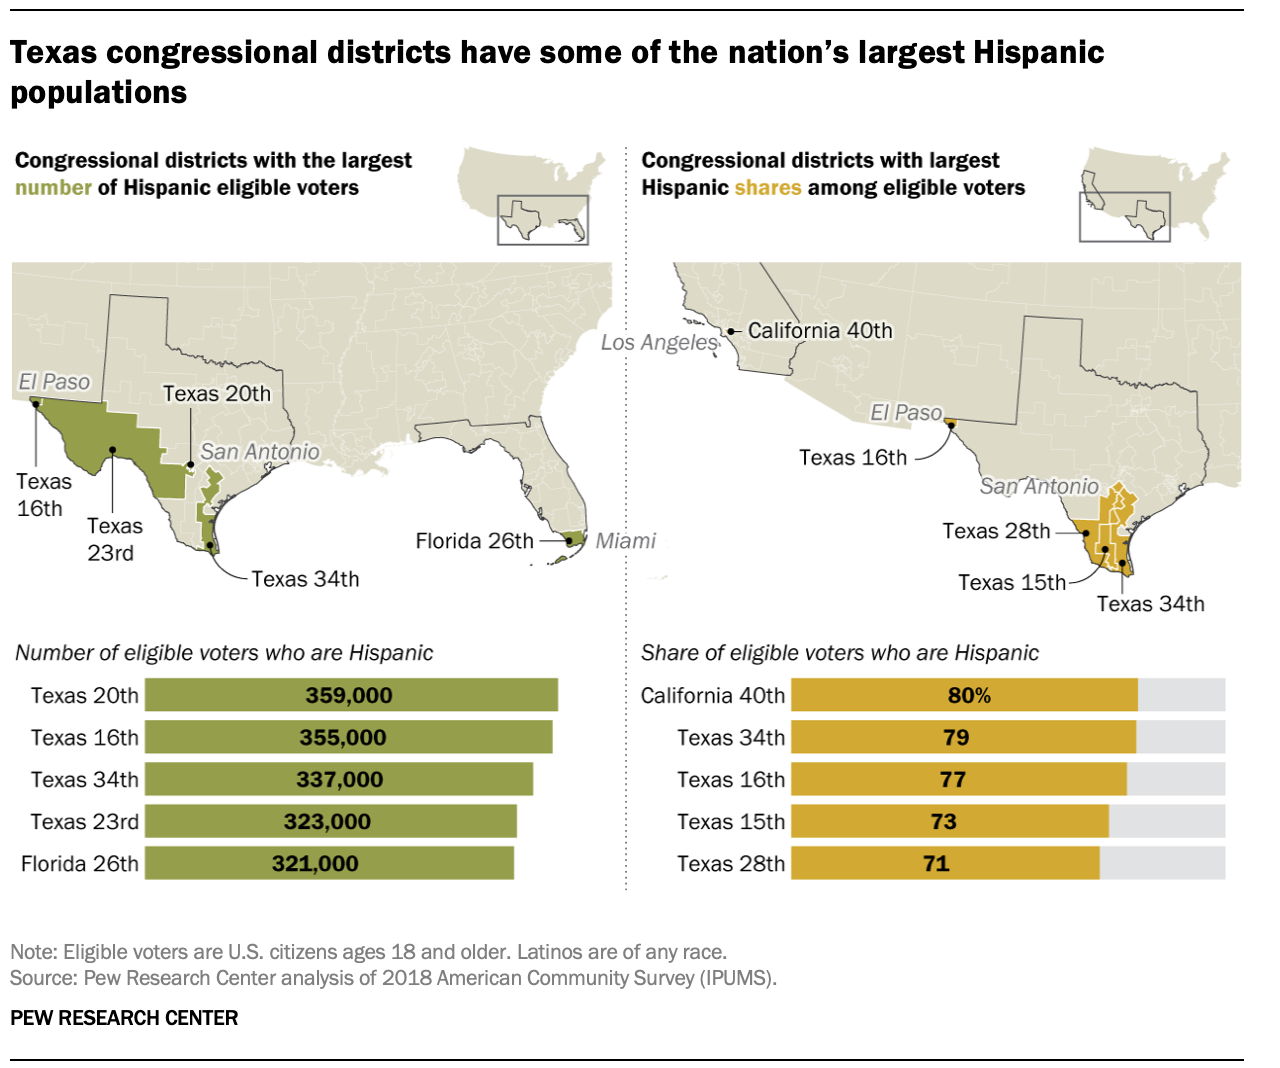
Texas’ 20th Congressional District is home to 359,000 Latino eligible voters, the highest number of any congressional district in the country. Texas’ 16th, 34th and 23rd districts, and Florida’s 26th District, round out the top five, each with at least 321,000 Latino eligible voters.
[callout align=”alignright”]
Explore the data
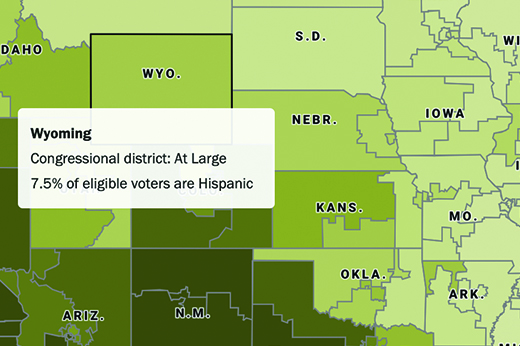
Explore interactive maps and tables showing key characteristics of Latino voters and overall eligible voter population in all 50 states and the District of Columbia, as well as in 414 of the nation’s 435 congressional districts.
California’s 40th District has the nation’s highest share (80%) of Latinos among its eligible voter population. Texas is home to the next four highest districts, where at least seven-in-ten eligible voters in each are Latino: the 34th District (79%), 16th District (77%), 15th District (73%) and the 28th District (71%).
In 26 congressional districts, Latinos represent at least half of all eligible voters. Most are in California (11 districts) and Texas (eight districts). Florida (25th, 26th and 27th districts), Arizona (3rd and 7th districts), New York (15th District) and Illinois (4th District) also are home to congressional districts that meet this threshold.
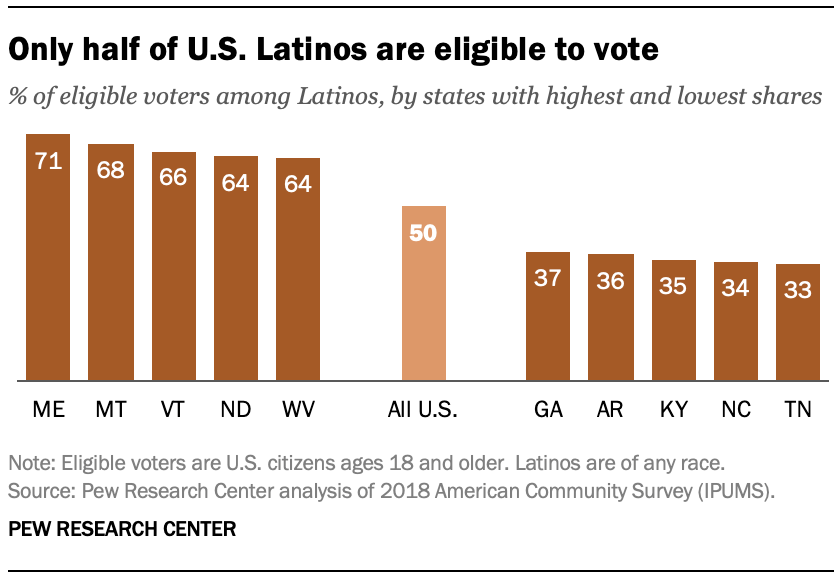
Only about half of the nation’s 60 million Hispanics are eligible to vote – the smallest share of any racial or ethnic group. While the Hispanic population has grown rapidly in recent decades, many are not eligible voters. More than other racial or ethnic groups, many Hispanics are young (18.6 million are under 18 years old) or non-citizen adults (11.3 million, more than half of whom are unauthorized immigrants).
The share of the Hispanic population that is eligible to vote varies greatly by state. About 71% of Maine’s Hispanic population is eligible to vote, as is 68% of Montana’s, the highest shares in the country. Among states with the largest Hispanic populations, about half or more of Hispanics are eligible to vote in Florida (56%), California (51%) and Texas (50%). The two states with the lowest shares of eligible voters among their Hispanic populations are North Carolina (34%) and Tennessee (33%).

